Figure 4. The number of retinal pigment
epithelium (RPE) cells that had entered the cell cycle 72 h after
lesioning were not directly associated with the lesion site. A:
Schematic representation of lesion configurations and demarcation of
center from periphery on an RPE tissue sheet. B: Total cell
numbers were counted in central and peripheral areas, both in terms of
those directly associated with a lesion and those distant from lesions.
Different combinations of lesions were applied. First, no lesion
(control), which represents Ki67 numbers in normal RPE. Second, cell
numbers found after one central lesion. Third, cell number after one
peripheral lesion. Finally numbers following after one central (c) and
one peripheral (p) lesion, and finally numbers following two central
and two peripheral lesions. Irrespective of the lesion configuration,
elevation in Ki67 positive cell number was always greater was always
greater in the periphery, even when only one central lesion was made.
While Ki67 numbers increased with lesion number, the number of Ki67
expressing cells found following two lesions in each area was not
greater than when one lesion was made in each area. The progressive
elevation in cell numbers was statistically significant between no
lesions and 1c+1p lesion (see the text for statistical significance).
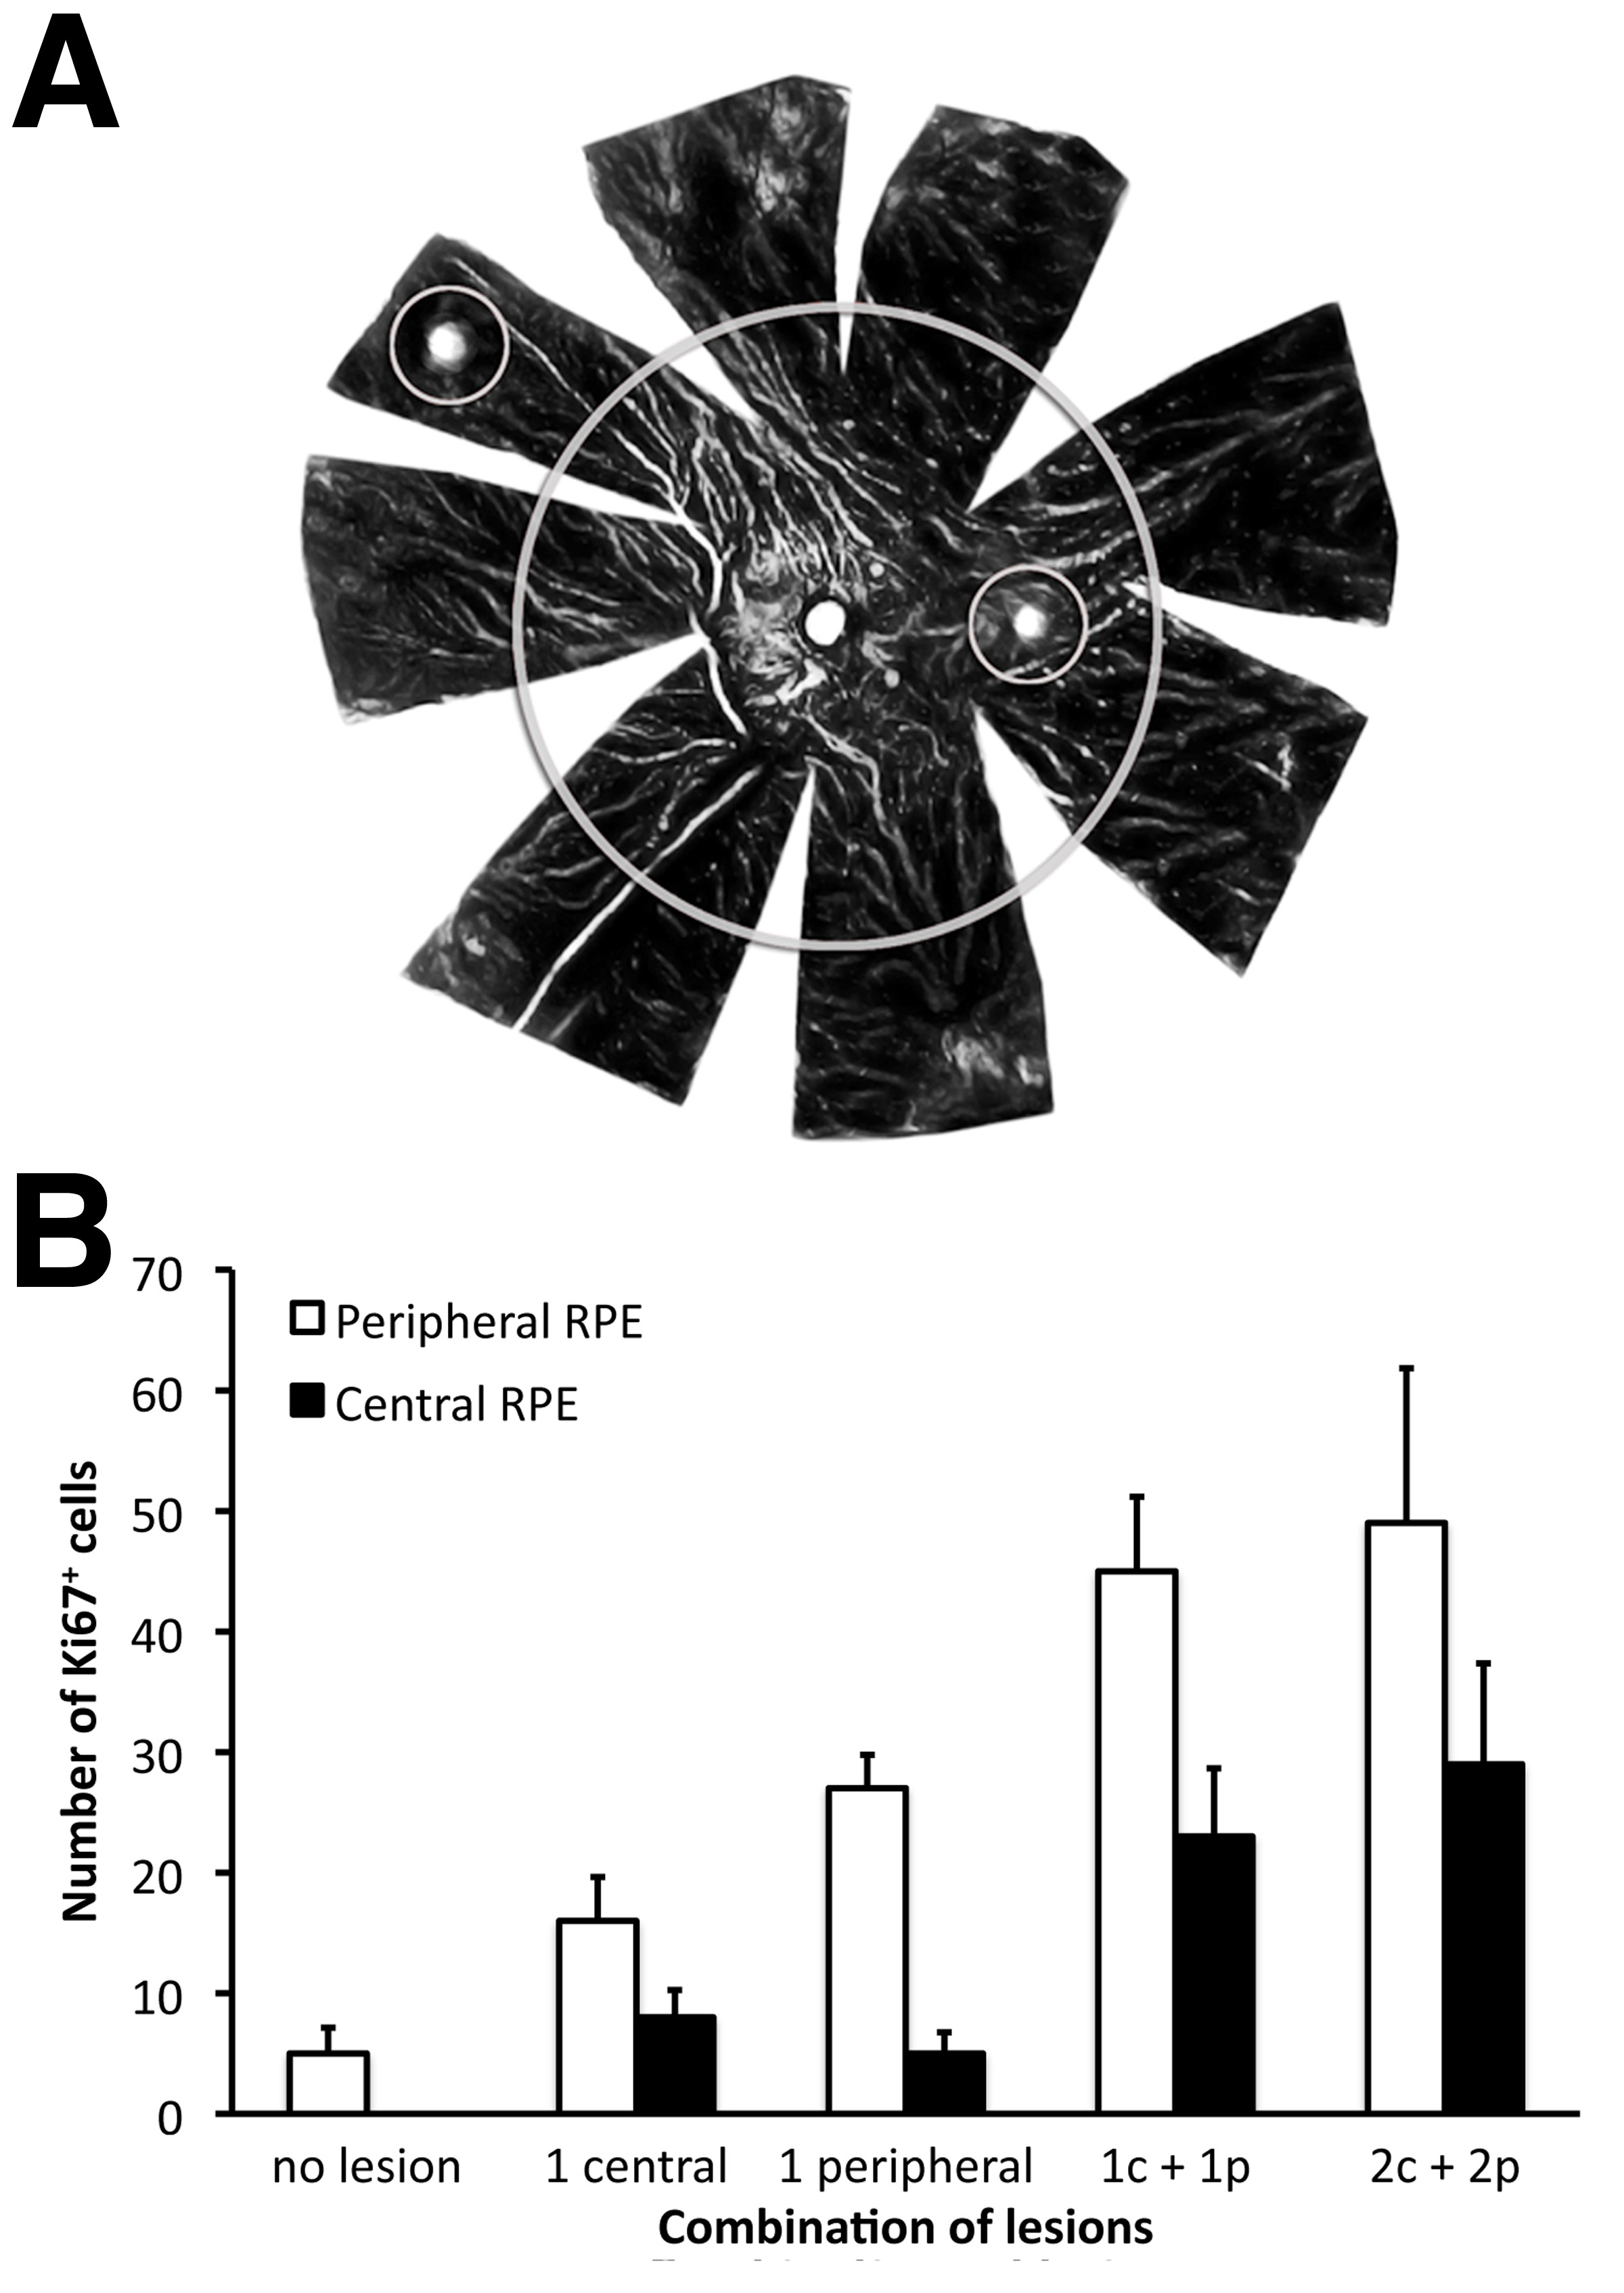
 Figure 4 of Lundh von Leithner, Mol Vis 2010; 16:570-581.