Figure 3. Levels of proliferation
determined by Ki67 positive label in central and peripheral regions.
But there were significantly higher levels of proliferation in retinal
periphery (A and C) compared to central retinas (B
and D). The graphs show the mean levels of Ki67 positive cells
in progressive annular regions around lesions. Differences were
statistically significant. Scale bars represent 100 µm.
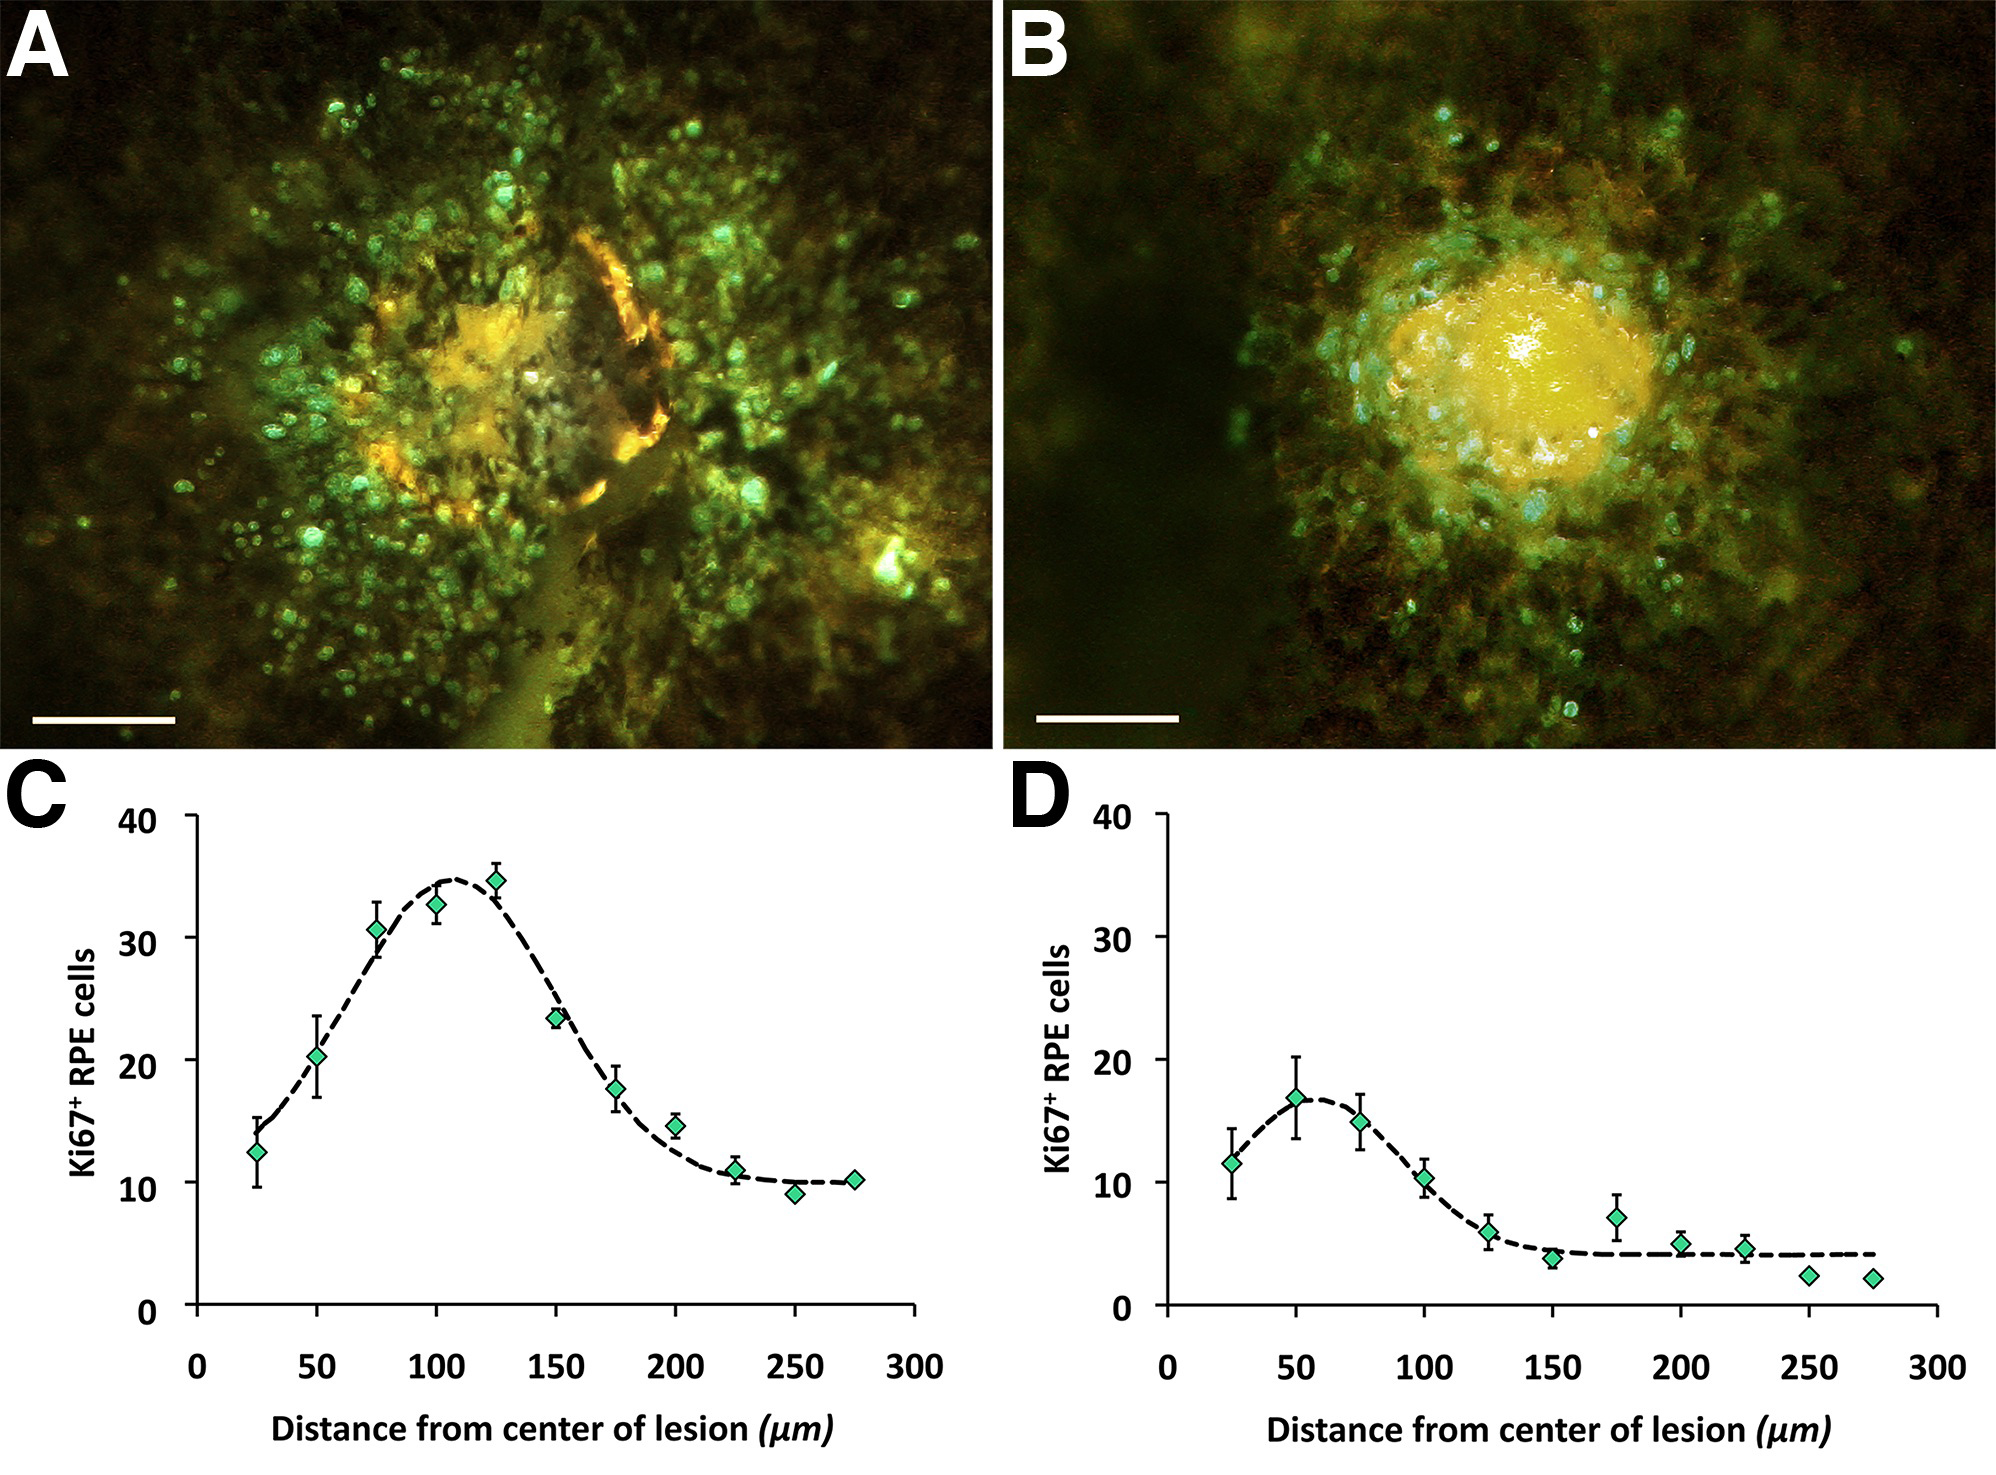
 Figure 3 of Lundh von Leithner, Mol Vis 2010; 16:570-581.