Figure 1. Pedigree and haplotype analysis
of CT1. A: The pedigree of family CT1 shows a high degree of
consanguinity in 7 generations. Two haplotypes are represented in the
pedigree; the spouse CT1–14 carries the identical mutation and shares
the identical haplotype distal to the FOXE3 gene. The two
haplotypes are shown as black or black and gray. Symbols: open circles
or squares are healthy individuals, filled symbols represent affected
individuals and half filled symbols represent carriers. B:
Restriction enzyme digests of all the family members where DNA was
available demonstrate the segregation of the mutation with the disease
in the family. The restriction enzyme DdeI recognizes the mutation and
cleaves the 204 bp band into two fragments of 131 bp and 73 bp. An
additional 75 bp band is observed in all individuals.
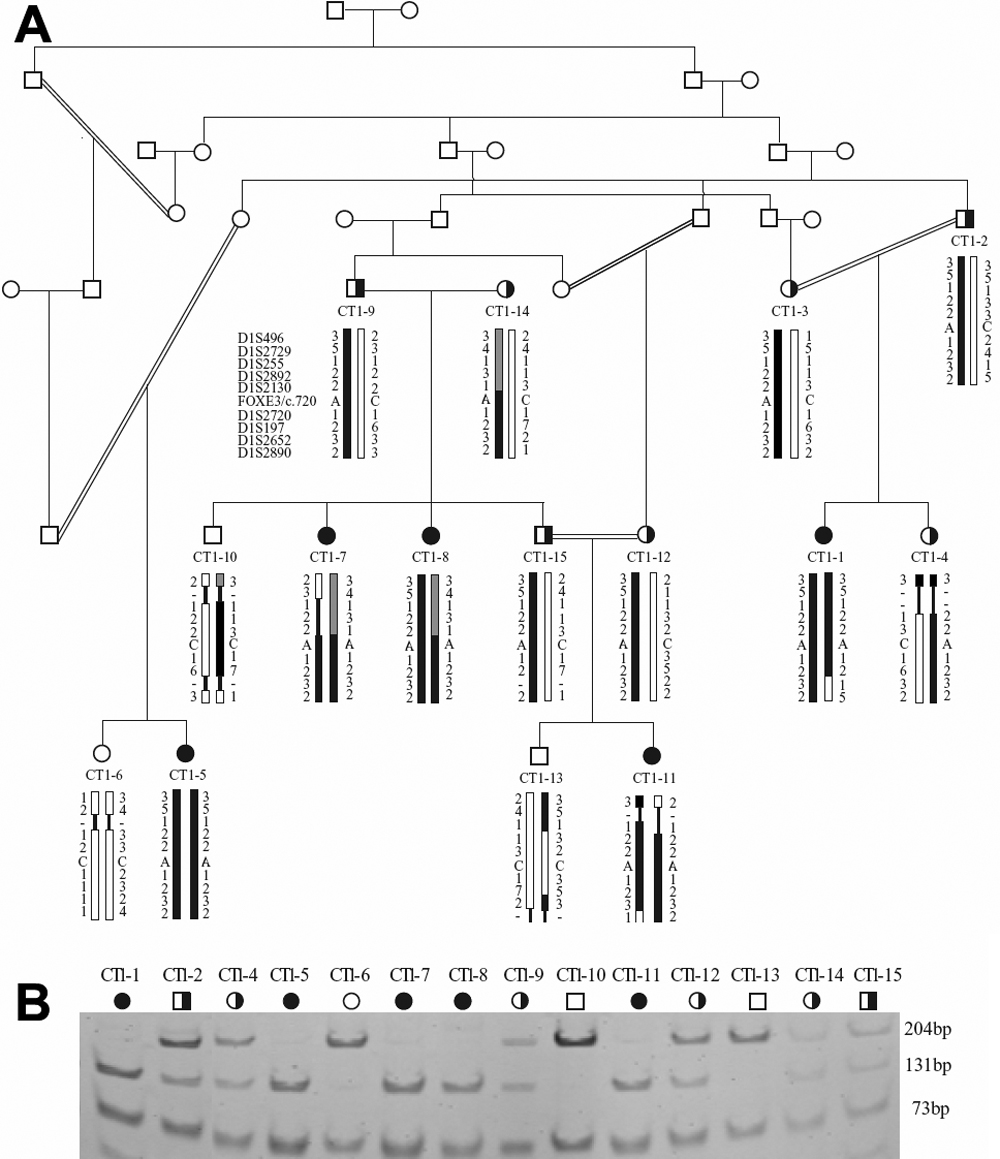
 Figure 1 of Anjum, Mol Vis 2010; 16:549-555.