Figure 4. Pedigrees and electropherograms
of families 1–4. The dark symbols in the pedigrees represent affected
individuals. The electropherograms show bi-directional sequencing of
the homozygous c.1143_1144 insC mutation in family 1 (A),
compound heterozygous c.201 G>A and c. 491_492 insT mutations in
family 2 (B), homozygous c.492 delC mutation in family 3 (C),
and
heterozygous c.1622_1625 delTCTG mutation in family 4 (D).
The heterozygous c.492 delC mutation in family 4 is not shown.
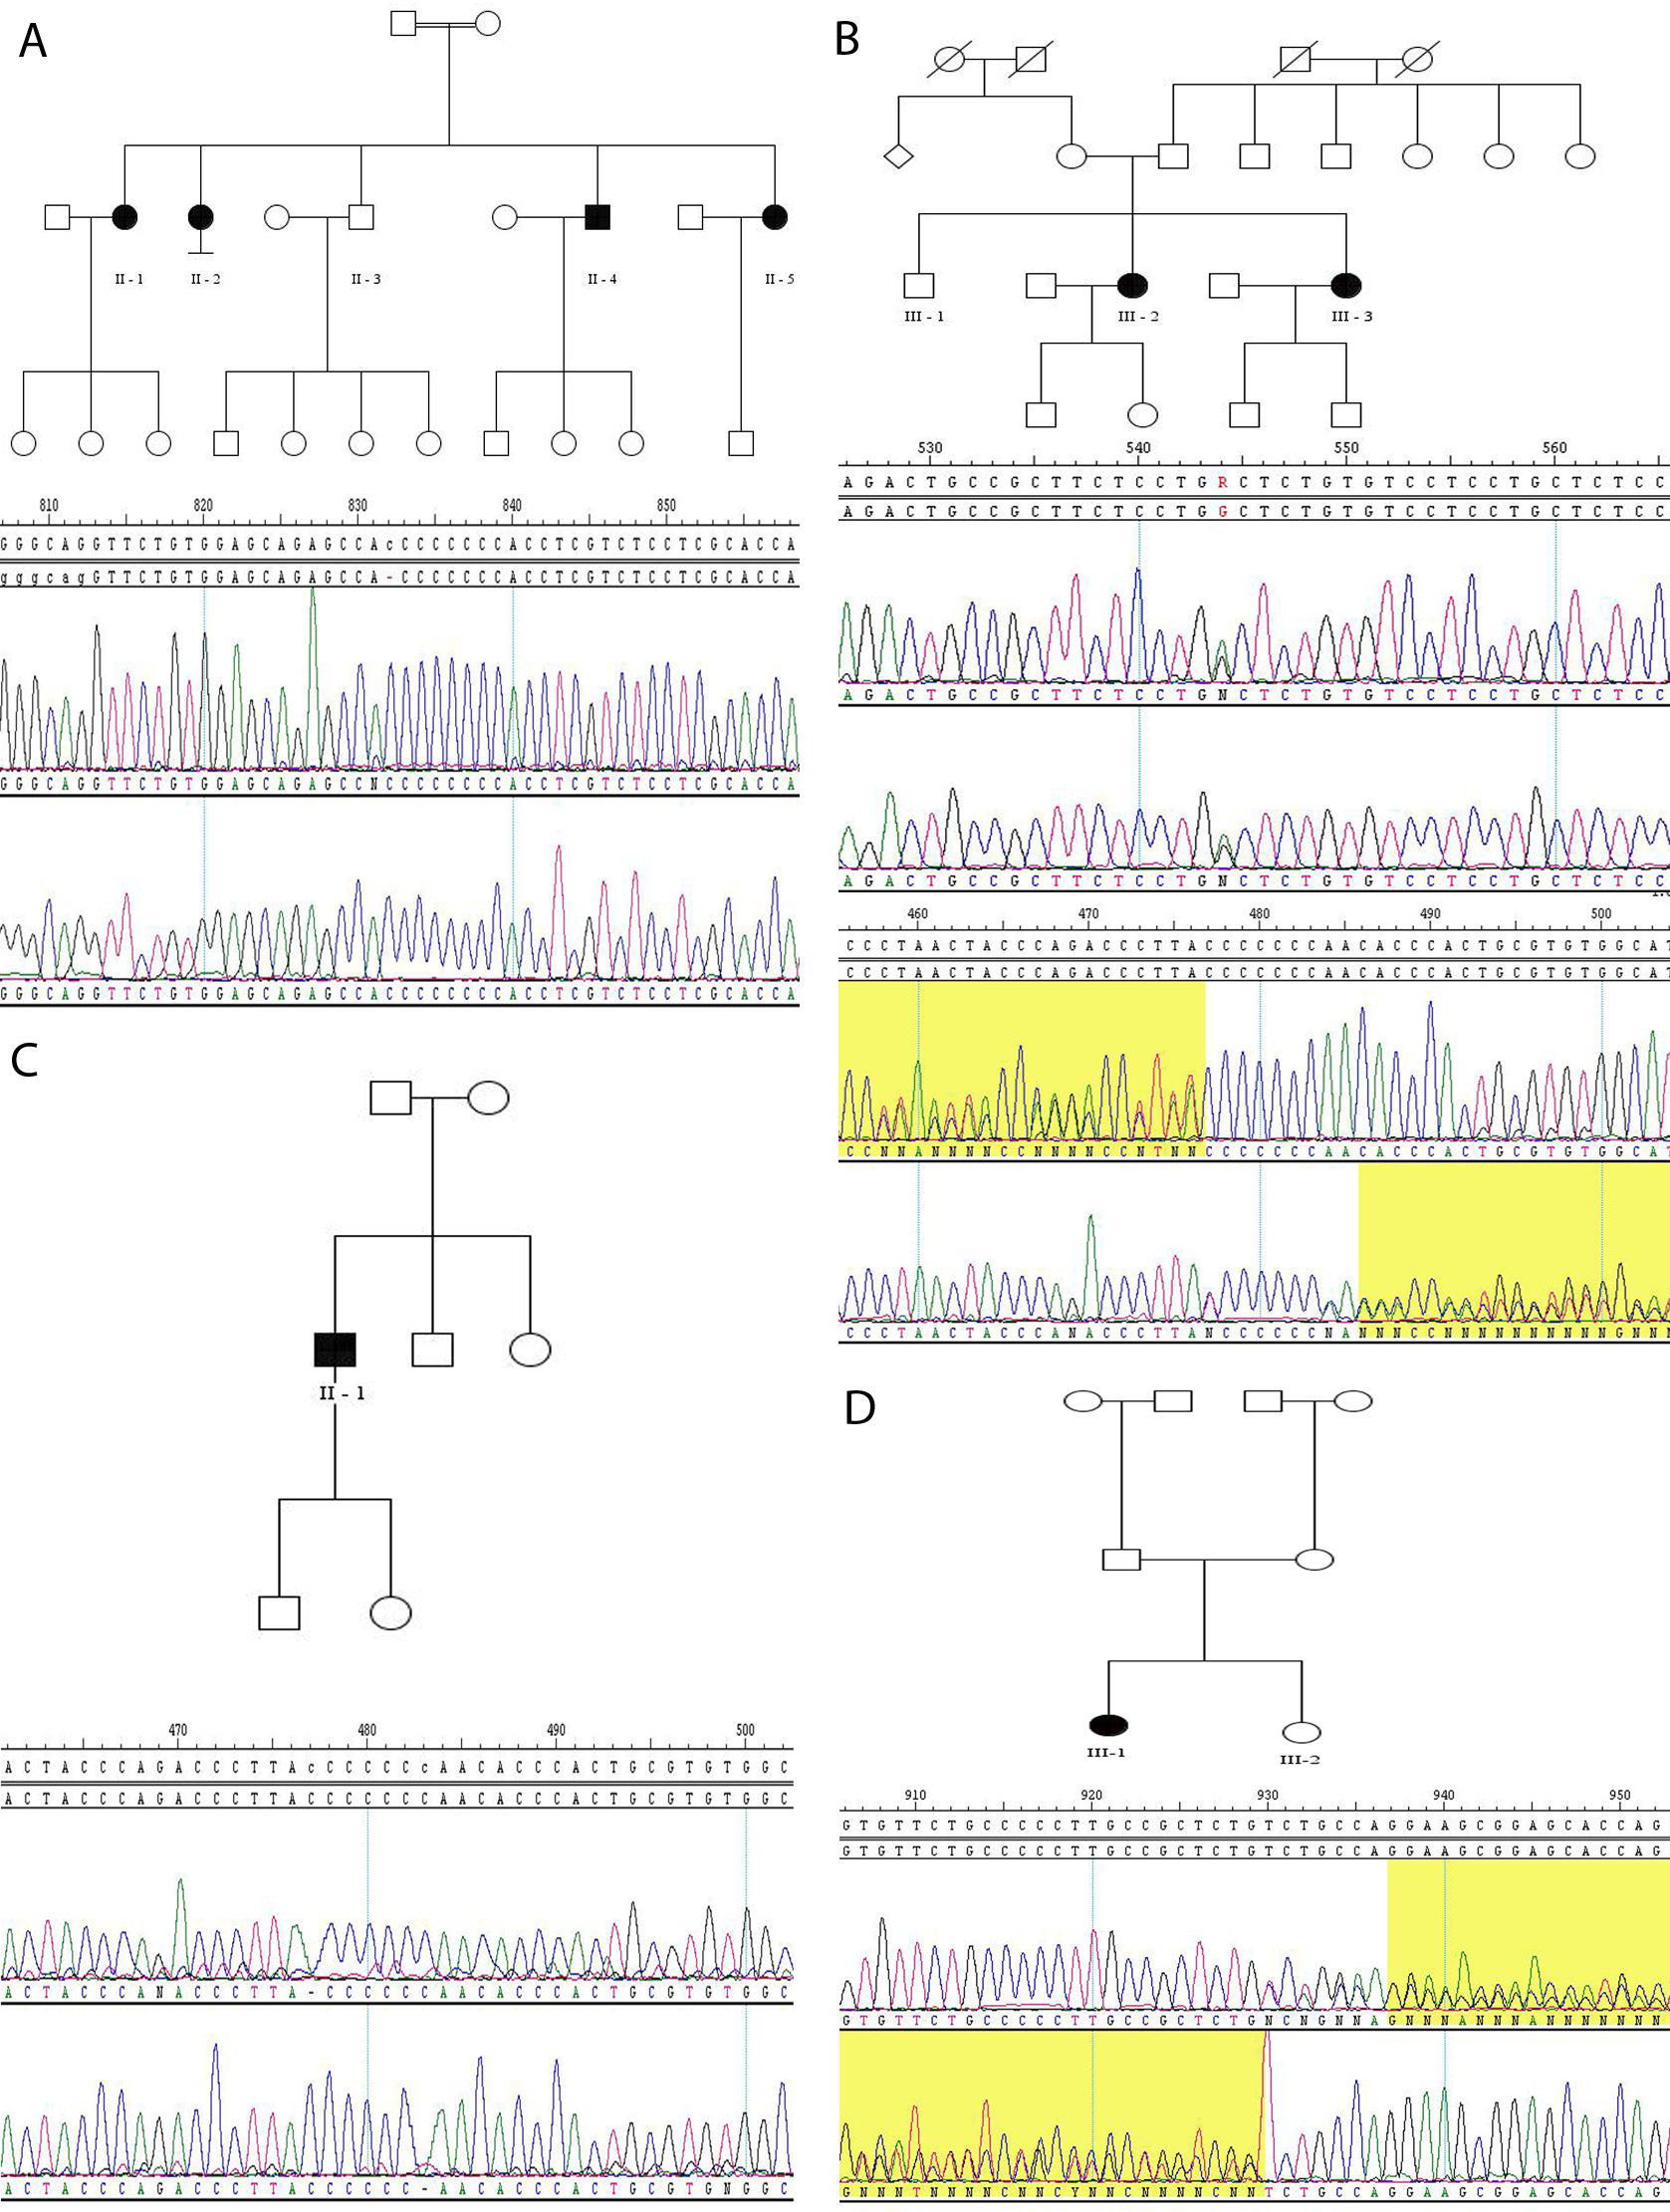
 Figure 4 of Mukhopadhyay, Mol Vis 2010; 16:540-548.