Figure 3. Typhoon-scanned fluorescence
images from a 2D-DIGE of a 69-year-old human lens. Equal concentrations
of protein (20 μg) from the cortex and nucleus were labeled with
different fluorescent dyes and analyzed by 2D-DIGE. A: Internal
standard labeled with Cy2 (Ex 488 nm, Em 520 nm). B: Cortical
proteins (outer and inner cortex pooled) labeled with Cy3 (Ex 532 nm,
Em 580 nm). C: Nuclear proteins labeled with Cy5 (Ex 633 nm, Em
670 nm). D: Overlay of A, B, and C.
Spots fluorescing white are protein species present in both cortex and
nucleus, while those fluorescing blue and red are localized to the
corresponding regions as shown in B and C, respectively.
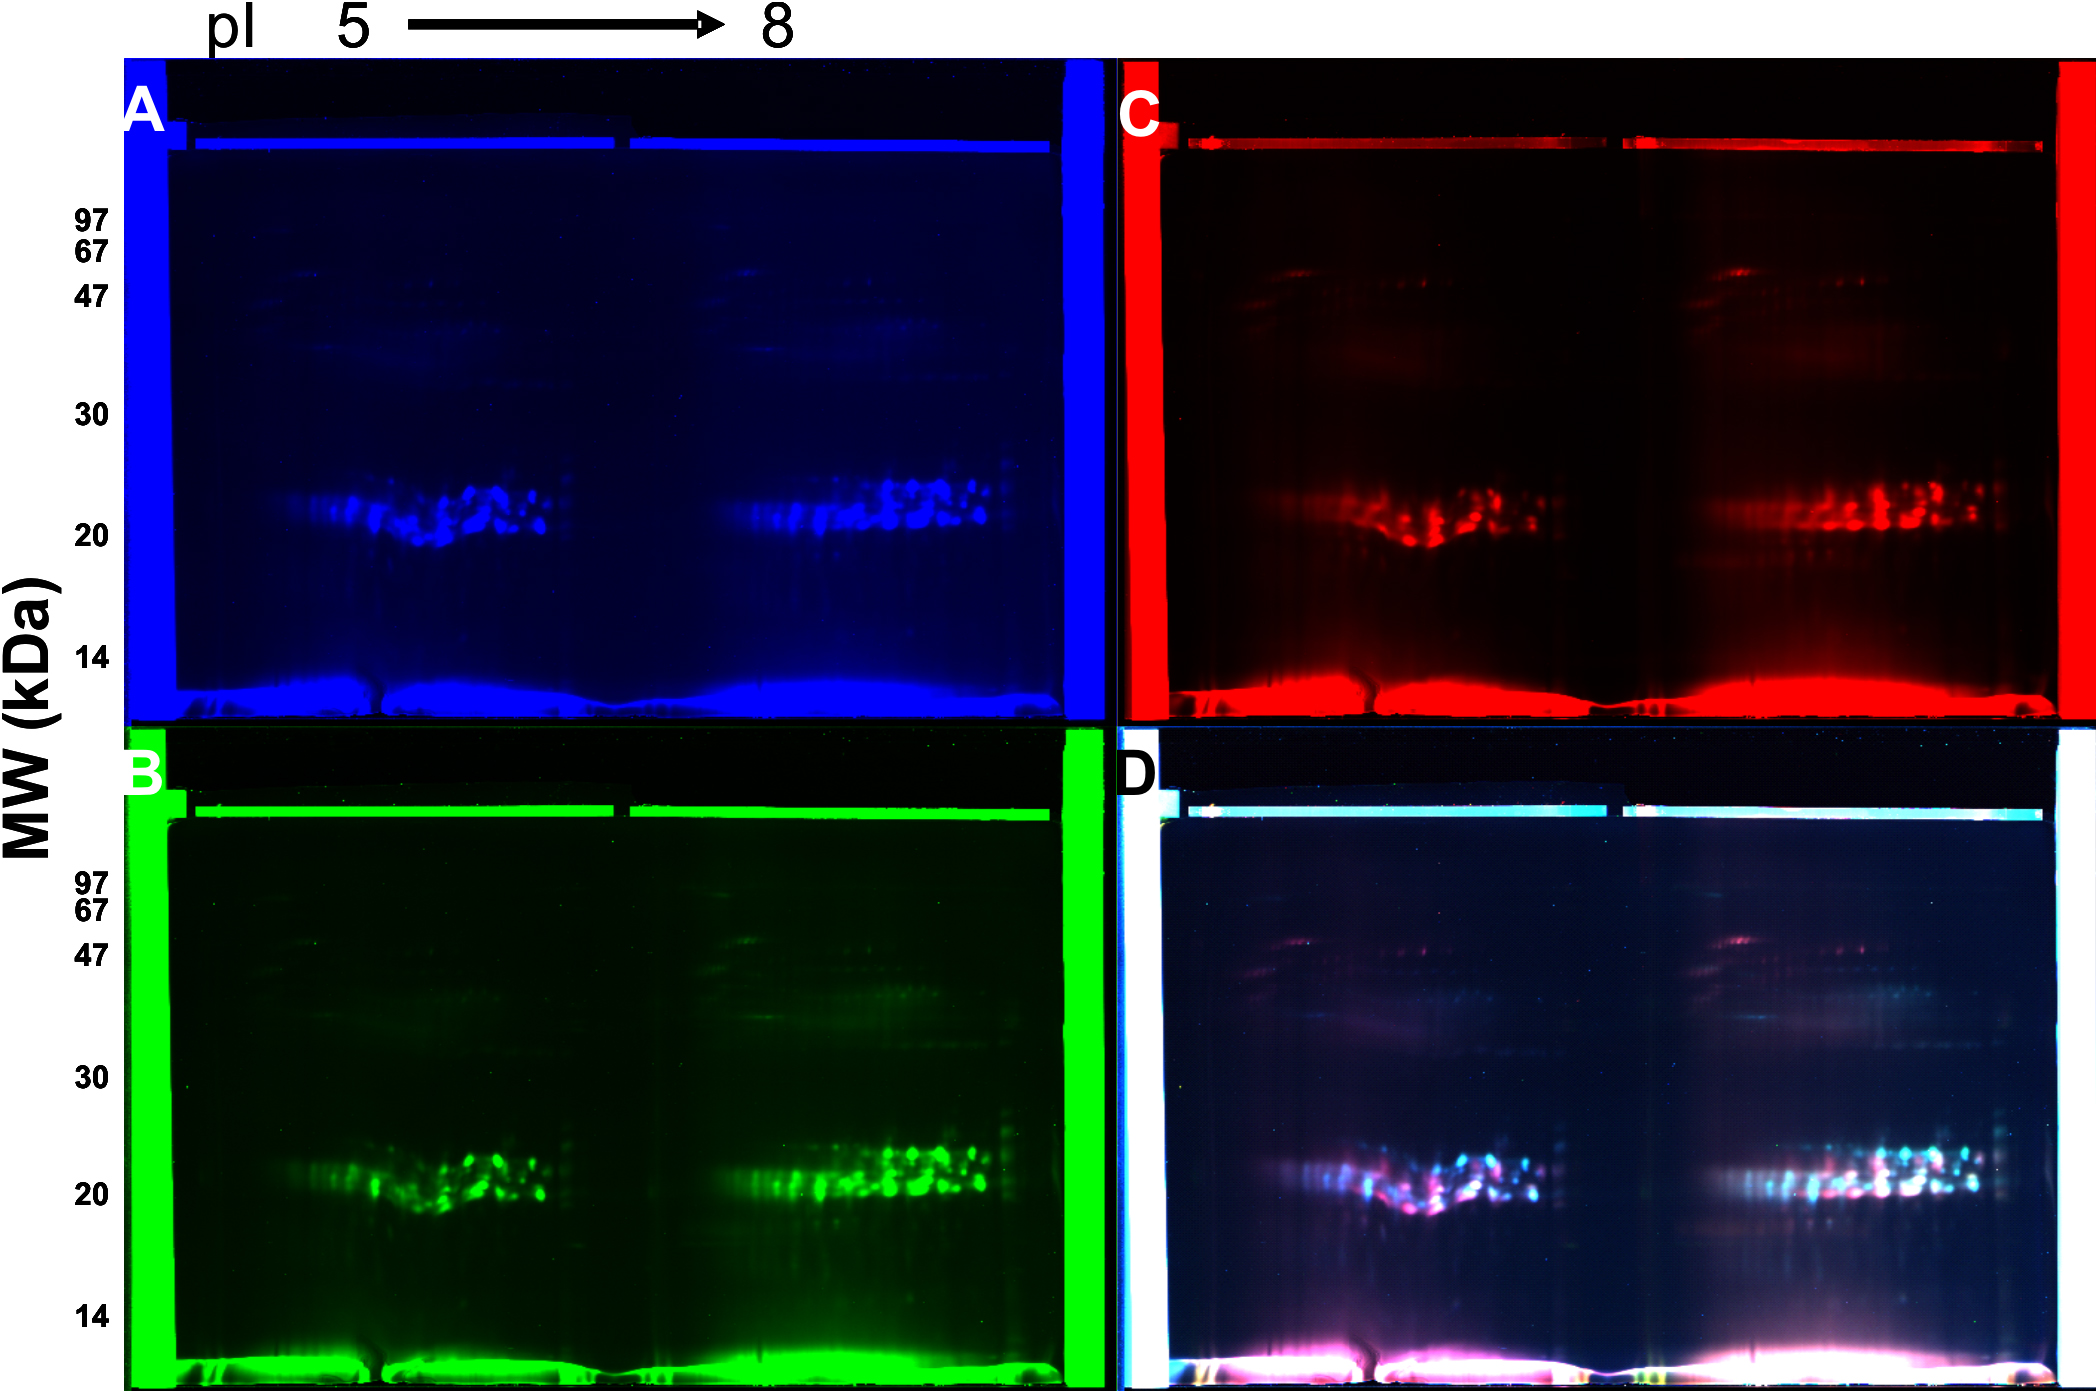
 Figure 3 of Asomugha, Mol Vis 2010; 16:476-494.