Figure 8. Occurrence of high molecular
weight proteins in lenticular urea-soluble protein fractions in
different groups of Wistar rats. Detection of changes in high molecular
weight insoluble protein by western blot analysis. Panels A, D,
and
G show immunoreactive bands of spectrin (240 kDa), vimentin
(57 kDa), and α-actin (42 kDa), respectively. Box-plots show the band
intensity of spectrin, vimentin, and α-actin, relative to the level in
10 day-old rat lenses (panels B, E, and H,
respectively). Linear regression analysis revealed a significant
negative correlation between the urea-soluble to soluble protein ratio
and the levels of spectrin, vimentin, and alpha-actin (panels C,
F, and I, respectively). (▲) Values in 10 day-old rat
lenses; (□) Values in 16 day-old rat lenses; (●) Values in 30 day-old
rat lenses; (♦) Values in 90 day-old rat lenses; (×) Values in 180
day-old rat lenses; (■) Values in 365 day-old rat lenses; (○) Values in
the lenses of 16 day-old rats that had been administered selenite on
post-partum day 10.
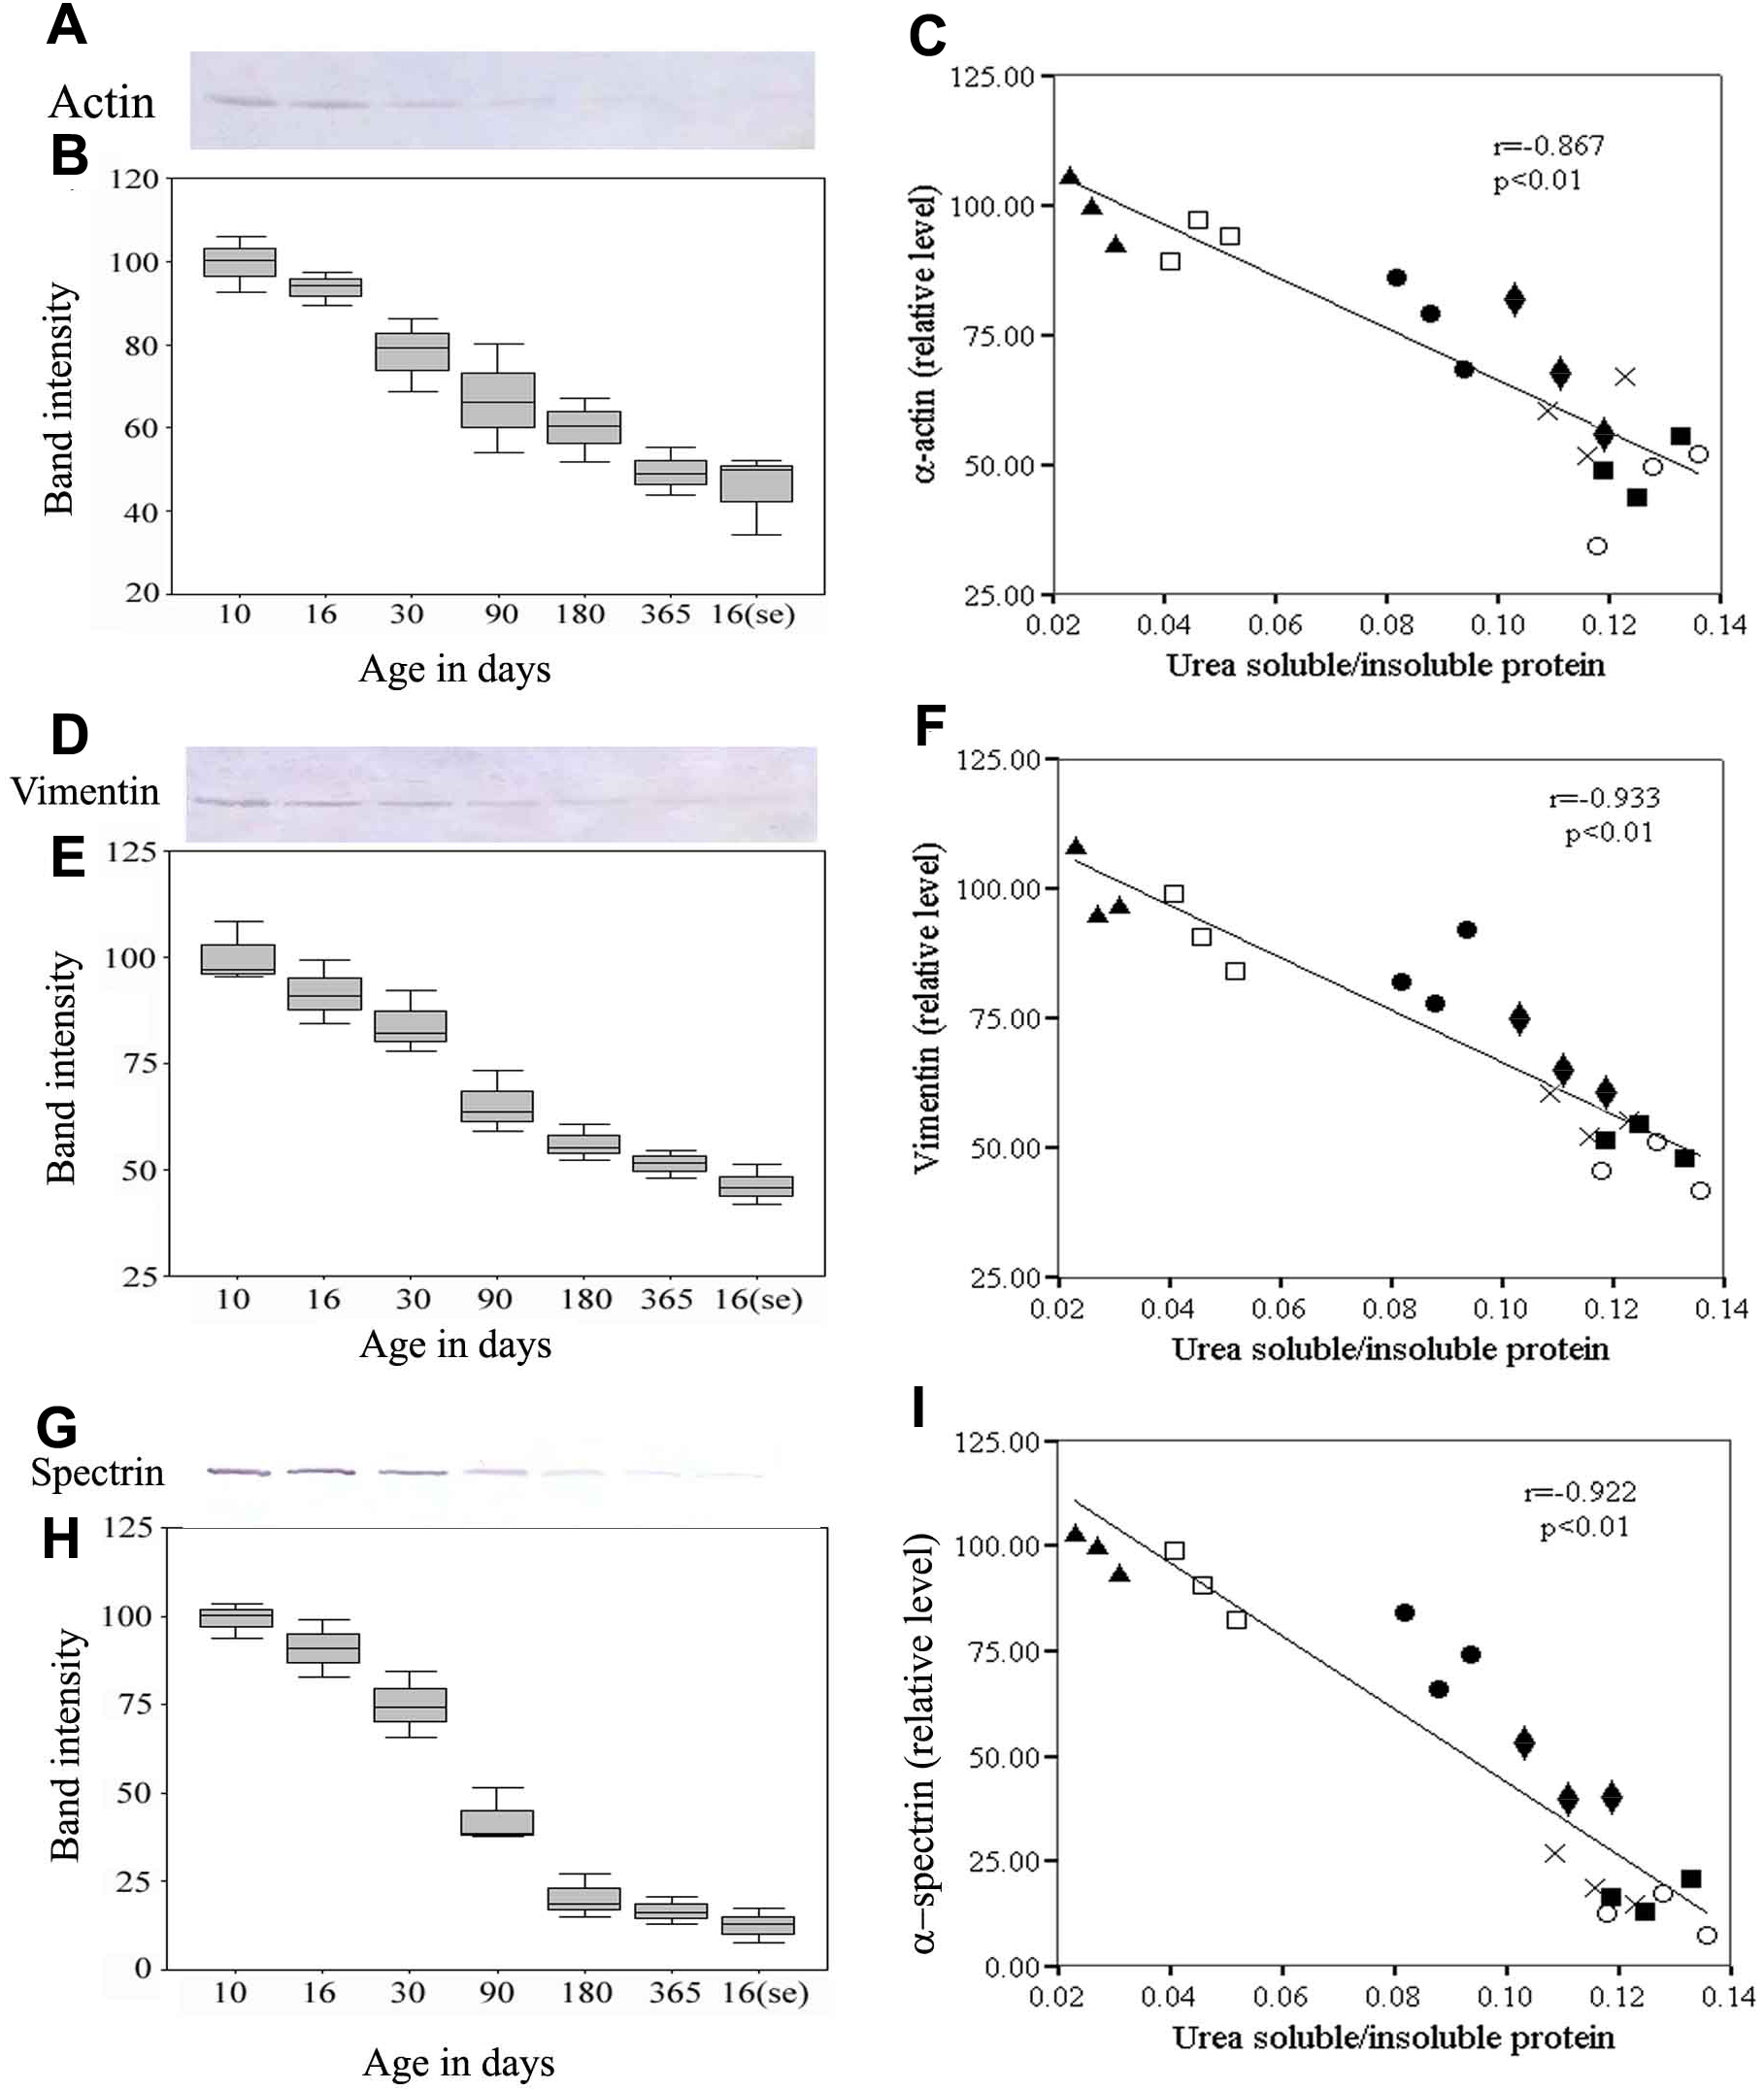
 Figure 8 of Sakthivel, Mol Vis 2010; 16:445-453.