Figure 4. Luciferase activities for
detection of protein–protein interactions involving various
βA3-crystallin deamidation mutants. Luciferase activity values are
expressed as fold activation relative to the basal control
(pCMV-AD+pCMV-BD). Various plasmid constructs were co-transfected as
labeled. Data represent the mean±SEM of results in three independent
experiments. Group differences were all compared with wild type
homodimer interaction (pAD-βA3+pBD-βA3). The asterisk indicates a
p<0.05 and the double asterisk indicates a p<0.01.
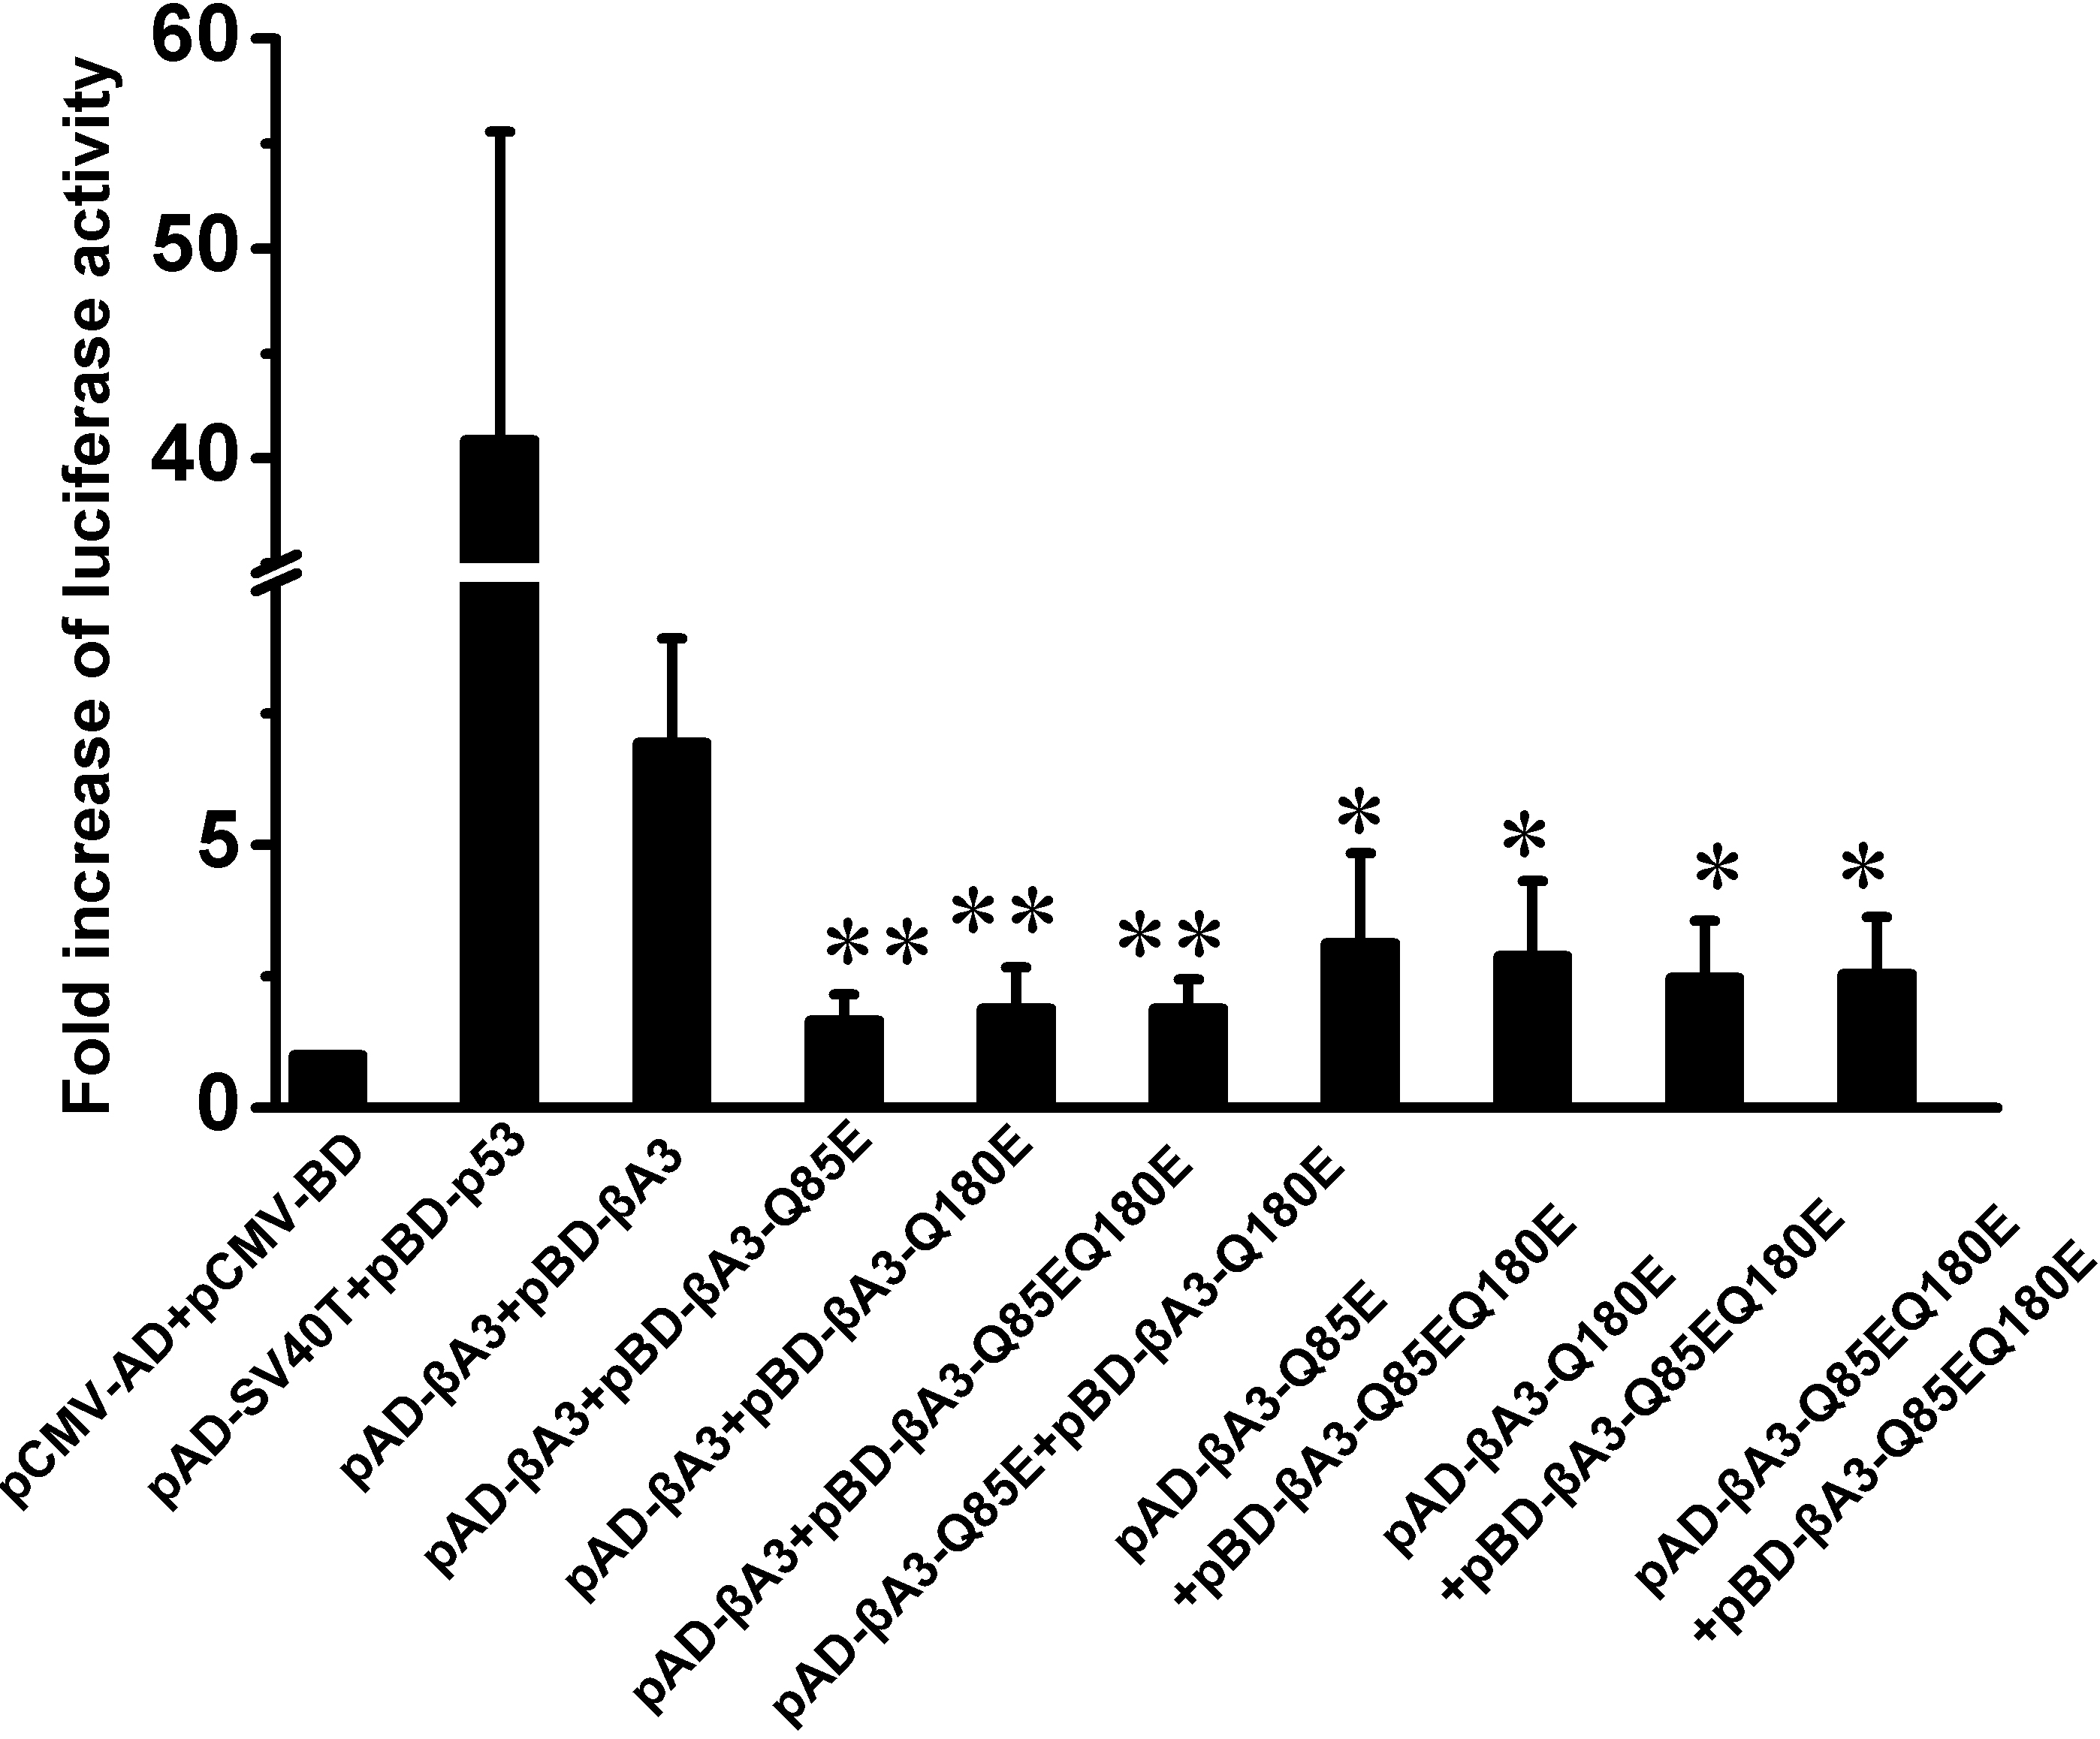
 Figure 4 of Xu, Mol Vis 2010; 16:438-444.