Figure 2. Protein hydrophobicity analysis of the wild type and the mutant βA3-crystallin. Kyte-Doolittle hydrophobicity plot of wild
type βA3-crystallin (A), ΔG91 mutant (B), and Q85E/Q180E mutant (C). X-axis represents amino acid position of, and y-axis represents hydropathy value in a window size of 5. The region of interest
is marked by blue box (for ΔG91 mutant) or white boxes (Q85E/Q180E mutant).
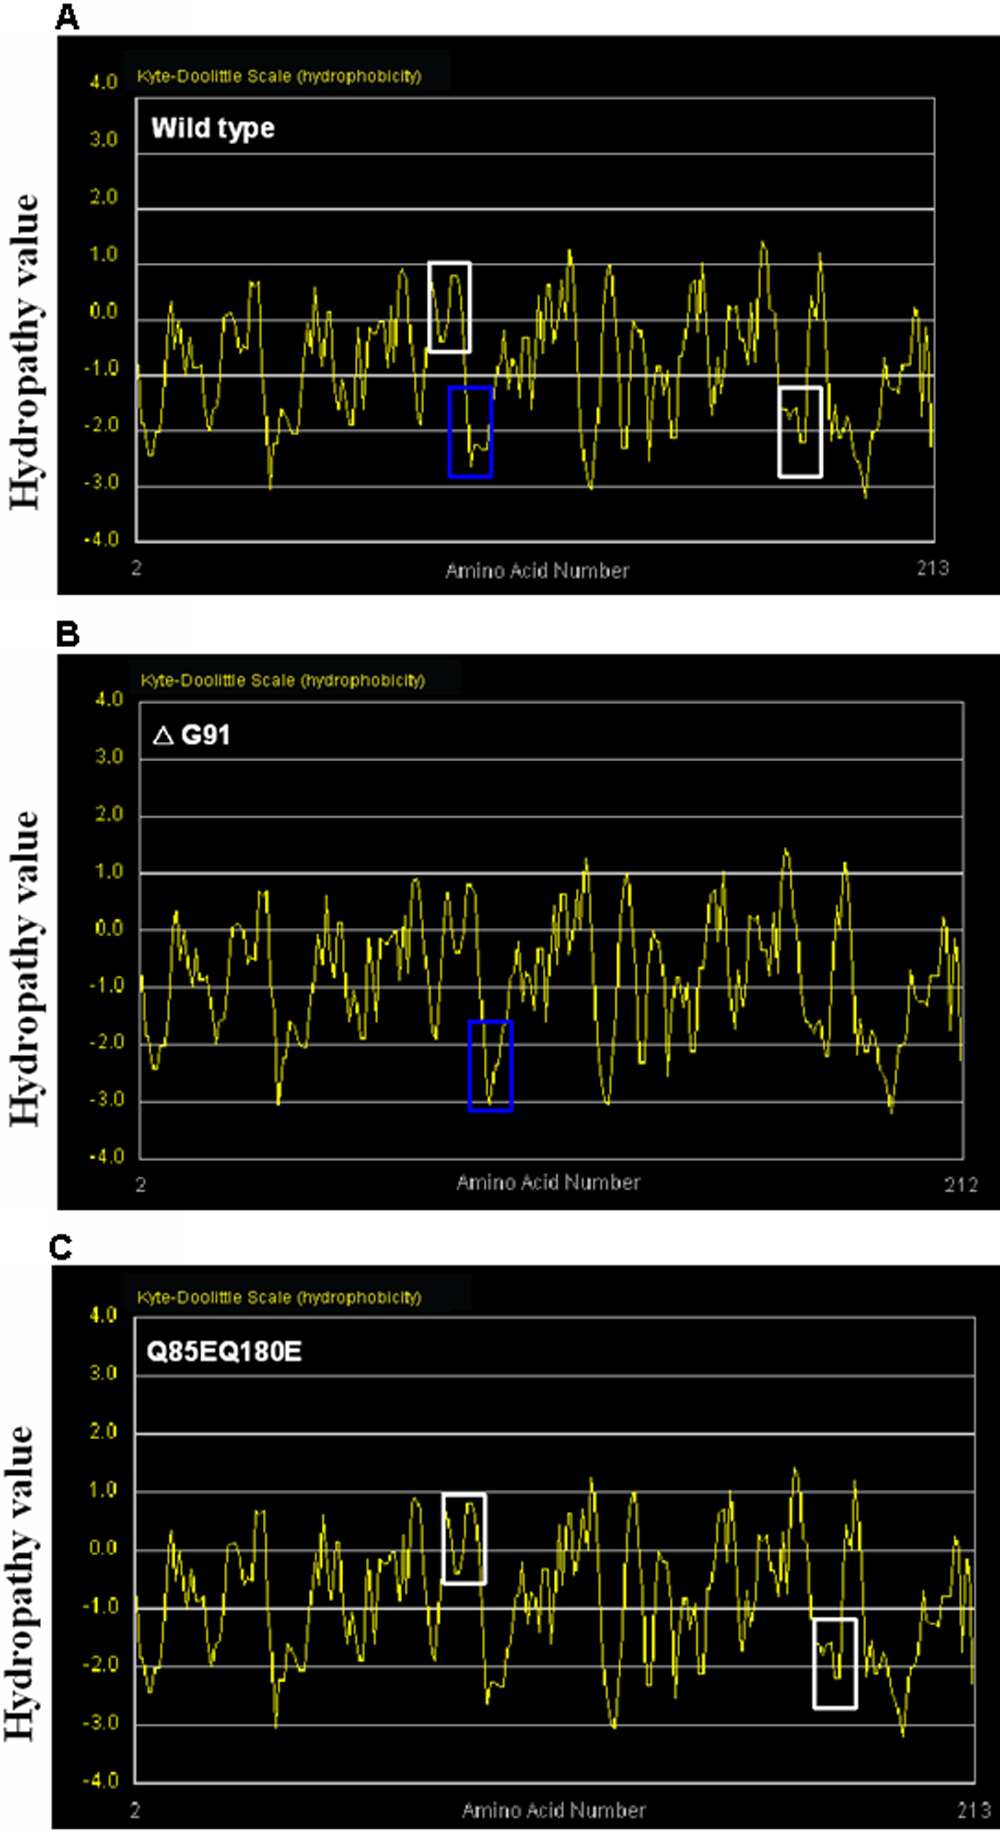
 Figure 2 of
Xu, Mol Vis 2010; 16:438-444.
Figure 2 of
Xu, Mol Vis 2010; 16:438-444.