Figure 6. ERG of WT and trpm1–/–
mice. A-F: ERGs recorded from 8-week-old mice.
Dark-adapted (A) and light-adapted (D) ERGs were elicited
by four different stimulus intensities in both WT and trpm1–/–
mice (n=5). Amplitudes of dark-adapted (B) and light-adapted (E)
ERG
a-waves as a function of the stimulus intensity are shown.
Amplitudes of dark-adapted (C) and light-adapted (F) ERG
b-waves as a function of the stimulus intensity are shown. The bars
represent the standard error of the mean (SEM). Asterisks show that the
differences are statistically significant (Mann–Whitney test,
p<0.05). The trpm1–/– mouse had a normal a-wave,
but a severely depressed b-wave for both dark- and light-adapted ERGs.
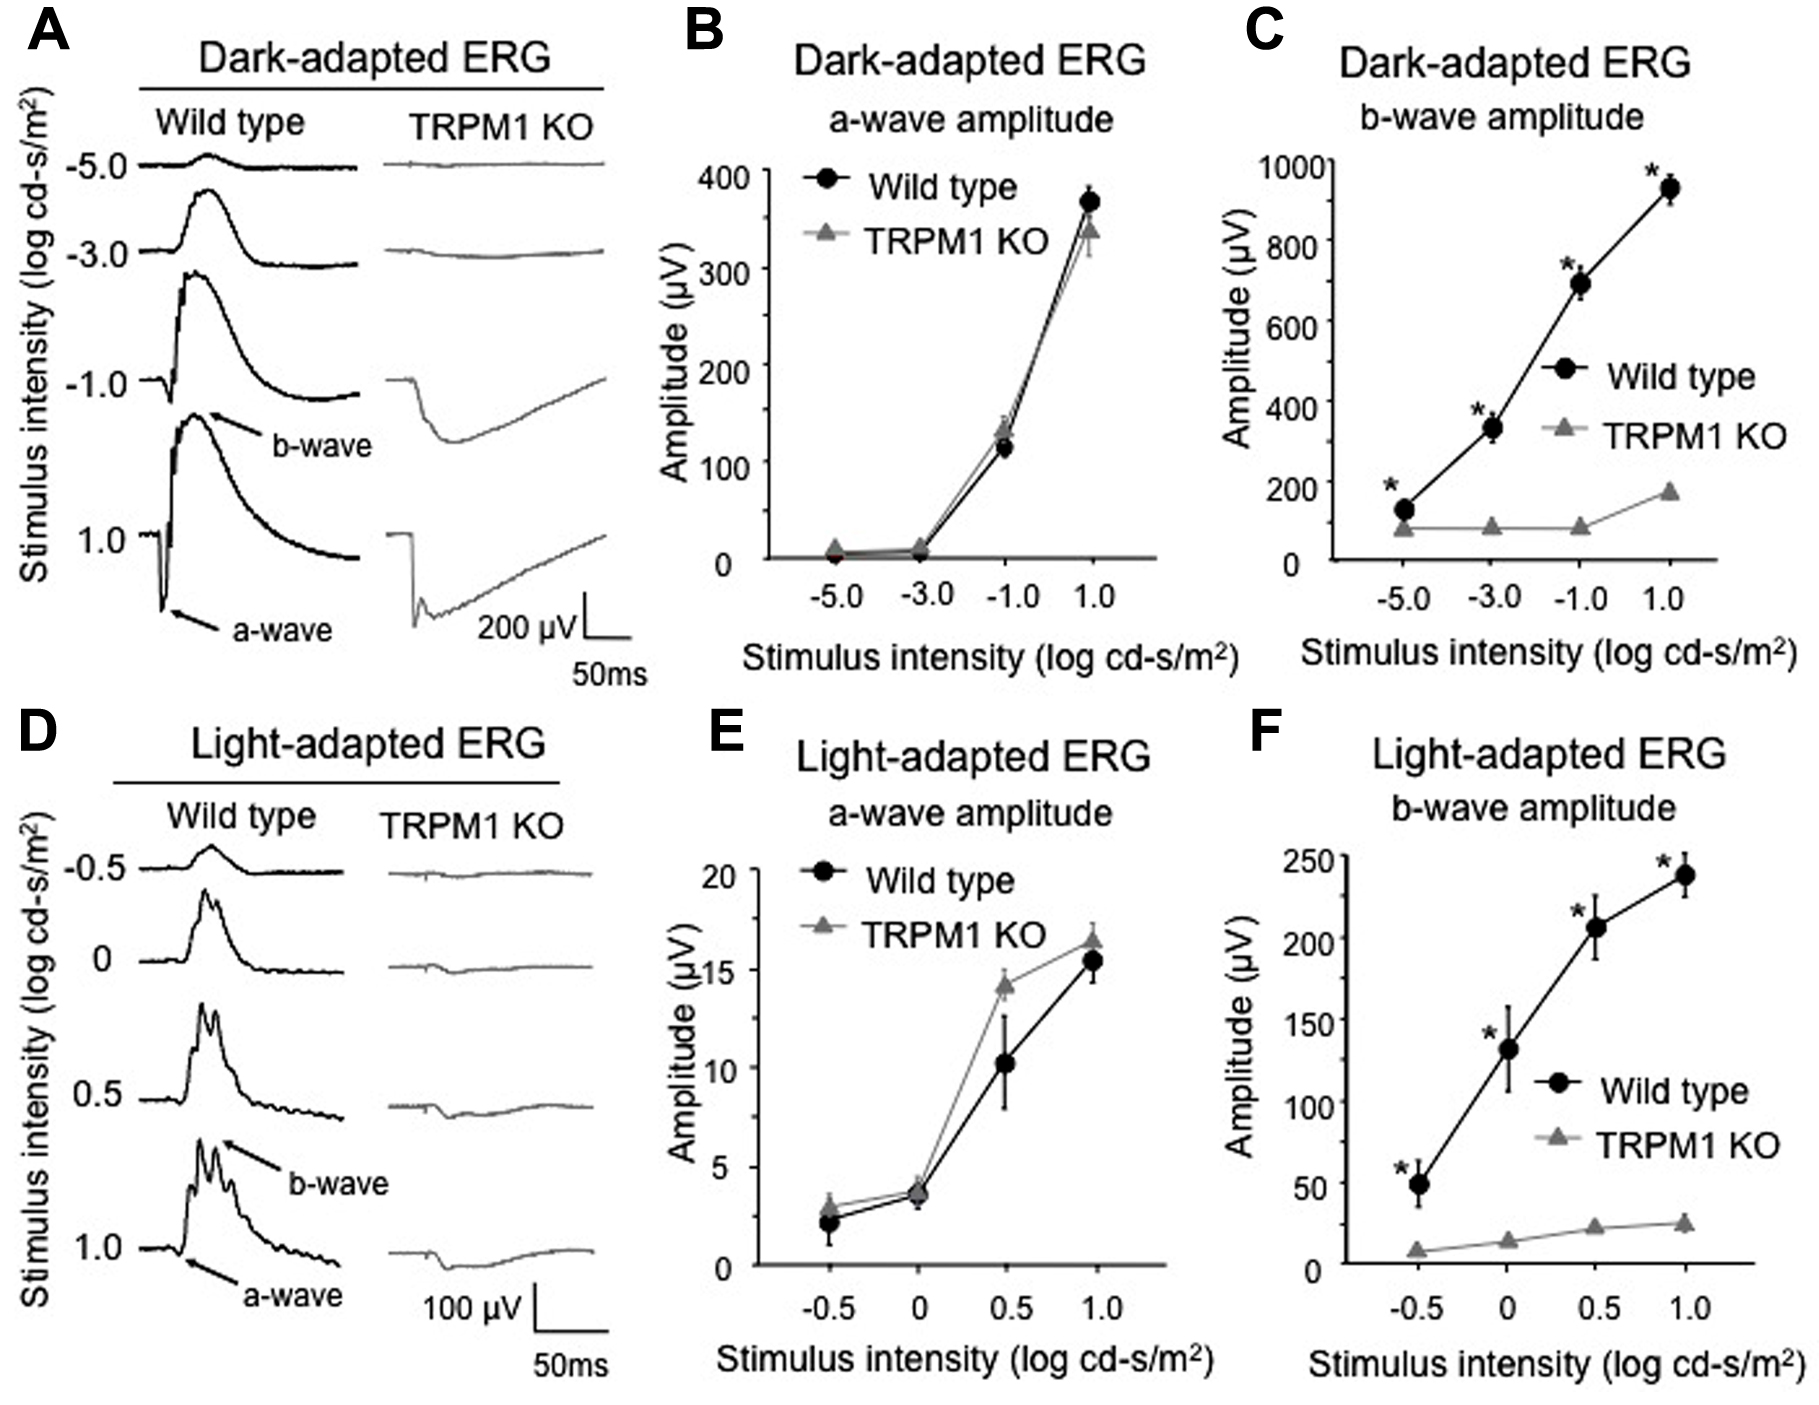
 Figure 6 of Nakamura, Mol Vis 2010; 16:425-437.