Figure 5. Full-field ERGs of patients with
mutations of the TRPM1 gene. A-D: Full-field
ERGs recorded in a normal subject and three affected individuals. The
single bright-flash, mixed rod-cone ERGs showed a “negative-type”
configuration with a reduced normal a-wave and a significantly reduced
b-wave amplitude (A). The scotopic ERGs showed no response after
20 min of dark-adaptation (B). The photopic ERGs showed an
apparent a-wave with normal implicit time and a b-wave with delayed
implicit time (C). The amplitudes of the 30 Hz flicker ERGs were
within normal range (D). The oscillatory potentials were
reduced. Arrowheads: stimulus onset. Each patient’s number is noted at
left.
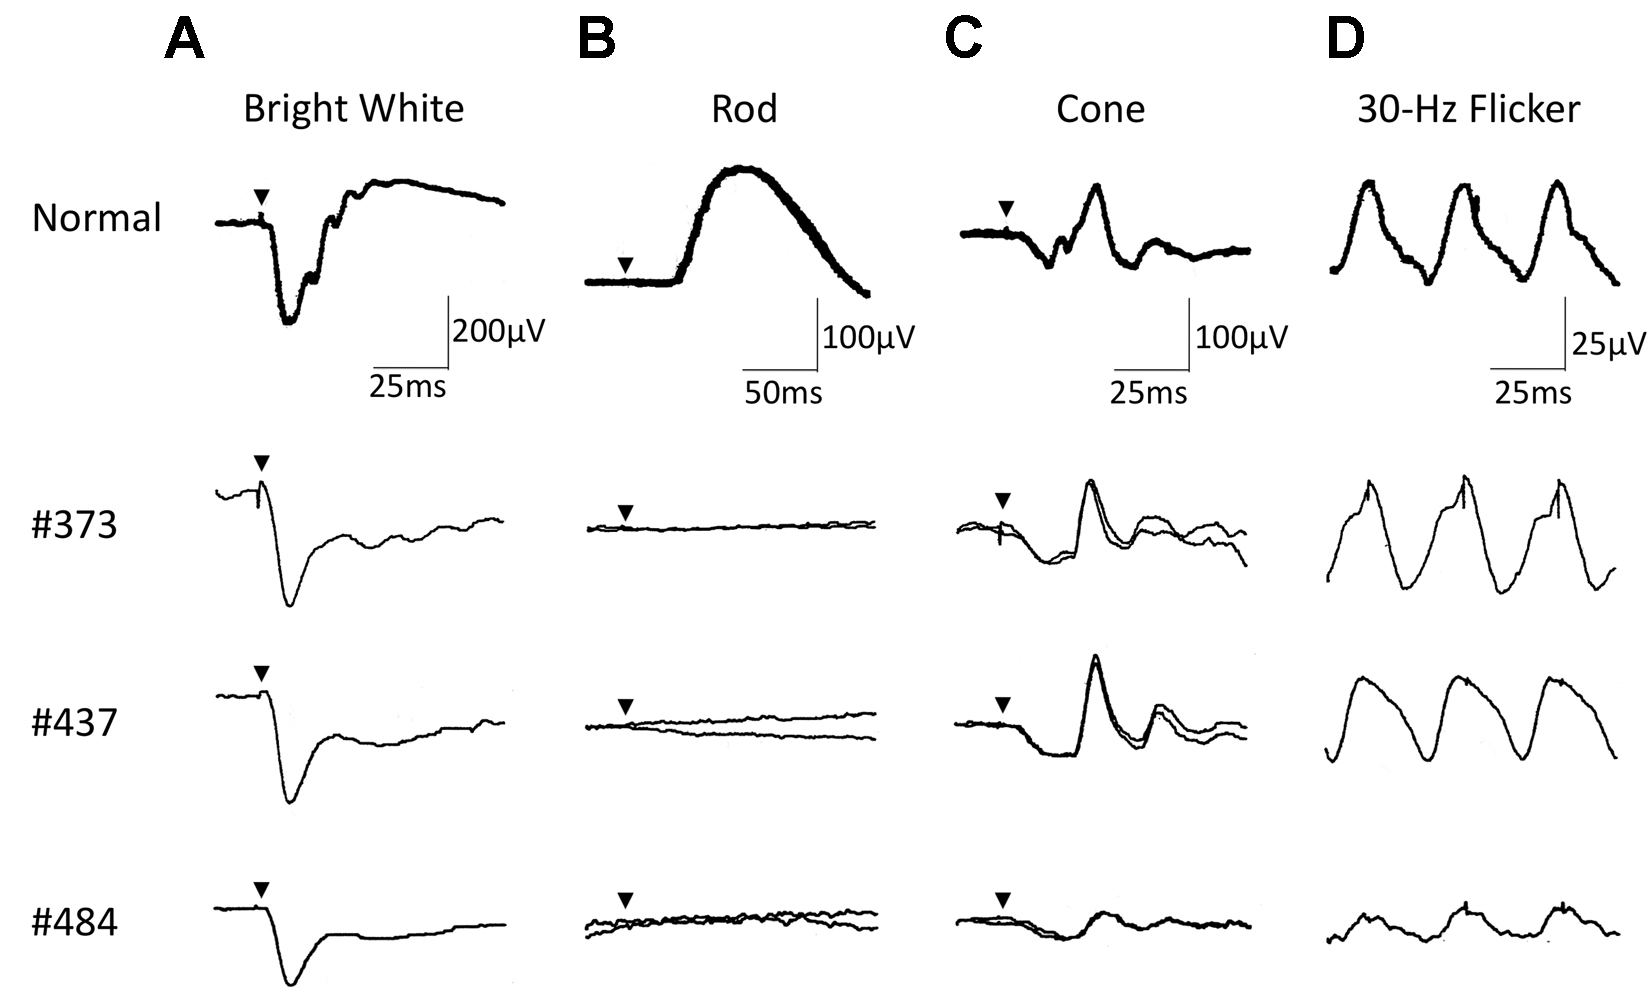
 Figure 5 of Nakamura, Mol Vis 2010; 16:425-437.