Figure 3. In vivo electroporation of WT, R624C, and F1075S TRPM1 expression vectors fused with the mGluR6 promoter. A: DNA constructs used for electroporation. CAG-GFP was co-electroporated to identify electroporated regions. WT and mutant forms of TRPM1 fused with 3×Flag were expressed under the mouse mGluR6 9.5 kb promoter. B-G: Section immunohistochemistry of the P14 retinas electroporated in vivo at P0 with CAG-GFP and mGluR6-TRPM1–3×Flag. The sections were immunostained with PKCα (blue), GFP (green), and Flag (red) antibodies (B, D, and F). Immunostaining with Flag was visualized separately (C, E and G). Arrows represent the soma and arrowheads represent the dendritic tips of ON BC. Scale bar: 10 μm. H. Composition of electroporated ON BC (GFP+ PKCα+), where bright Flag signal was observed in the dendrites. The error bars
represent standard deviation (SD). Asterisks show that the differences are statistically significant (n=3) (Student’s t-test, p<0.05).
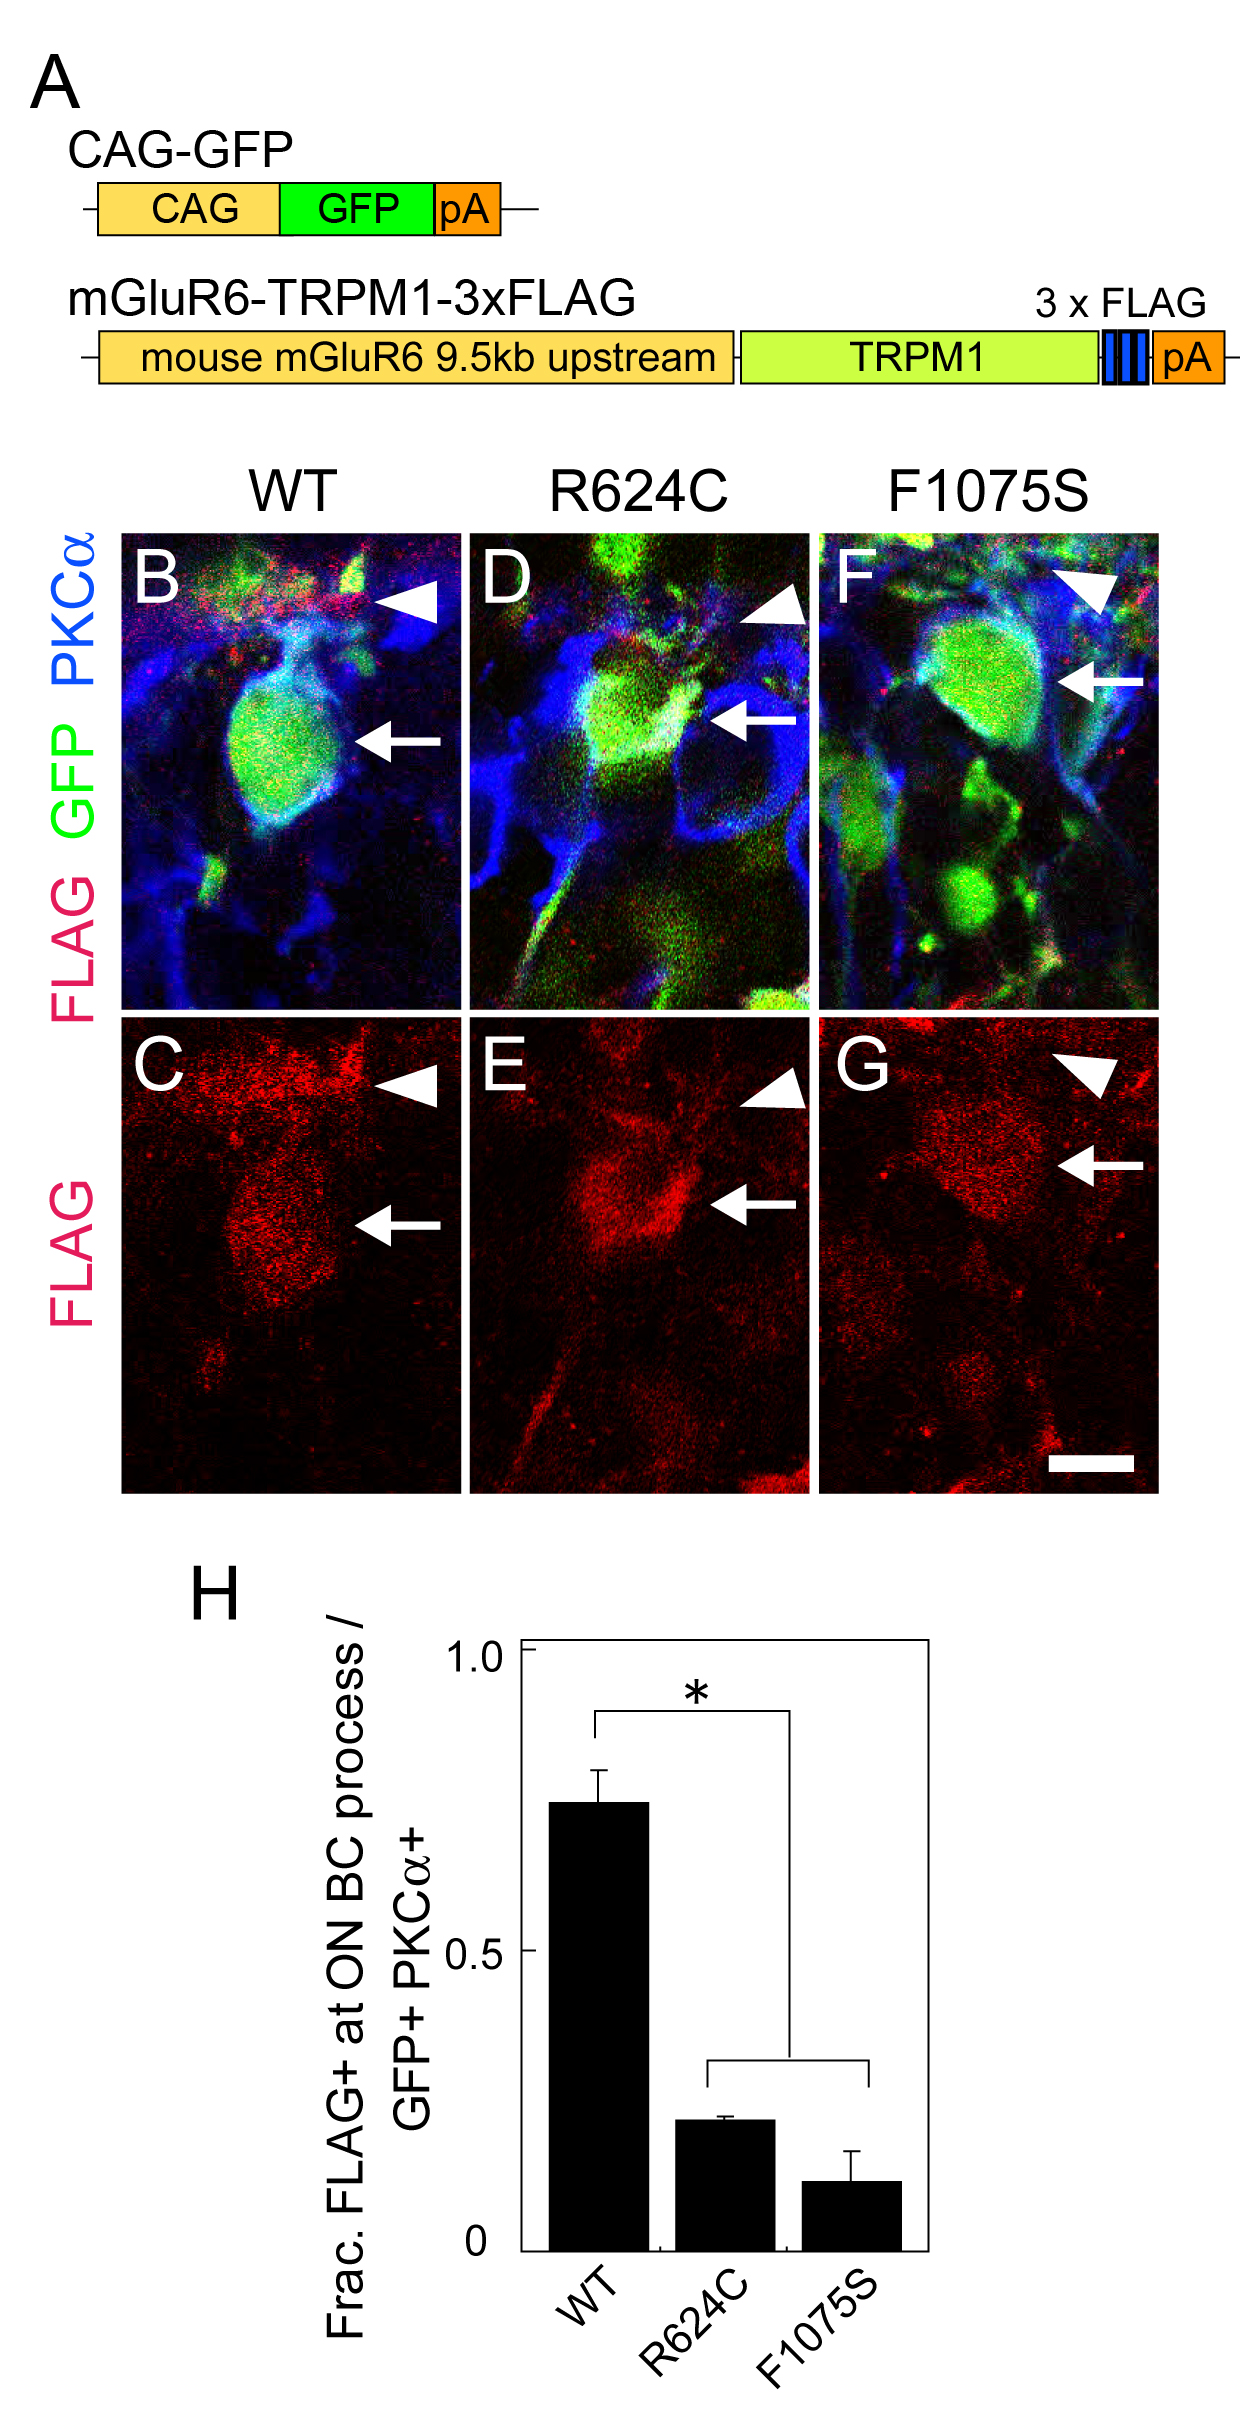
 Figure 3 of
Nakamura, Mol Vis 2010; 16:425-437.
Figure 3 of
Nakamura, Mol Vis 2010; 16:425-437.