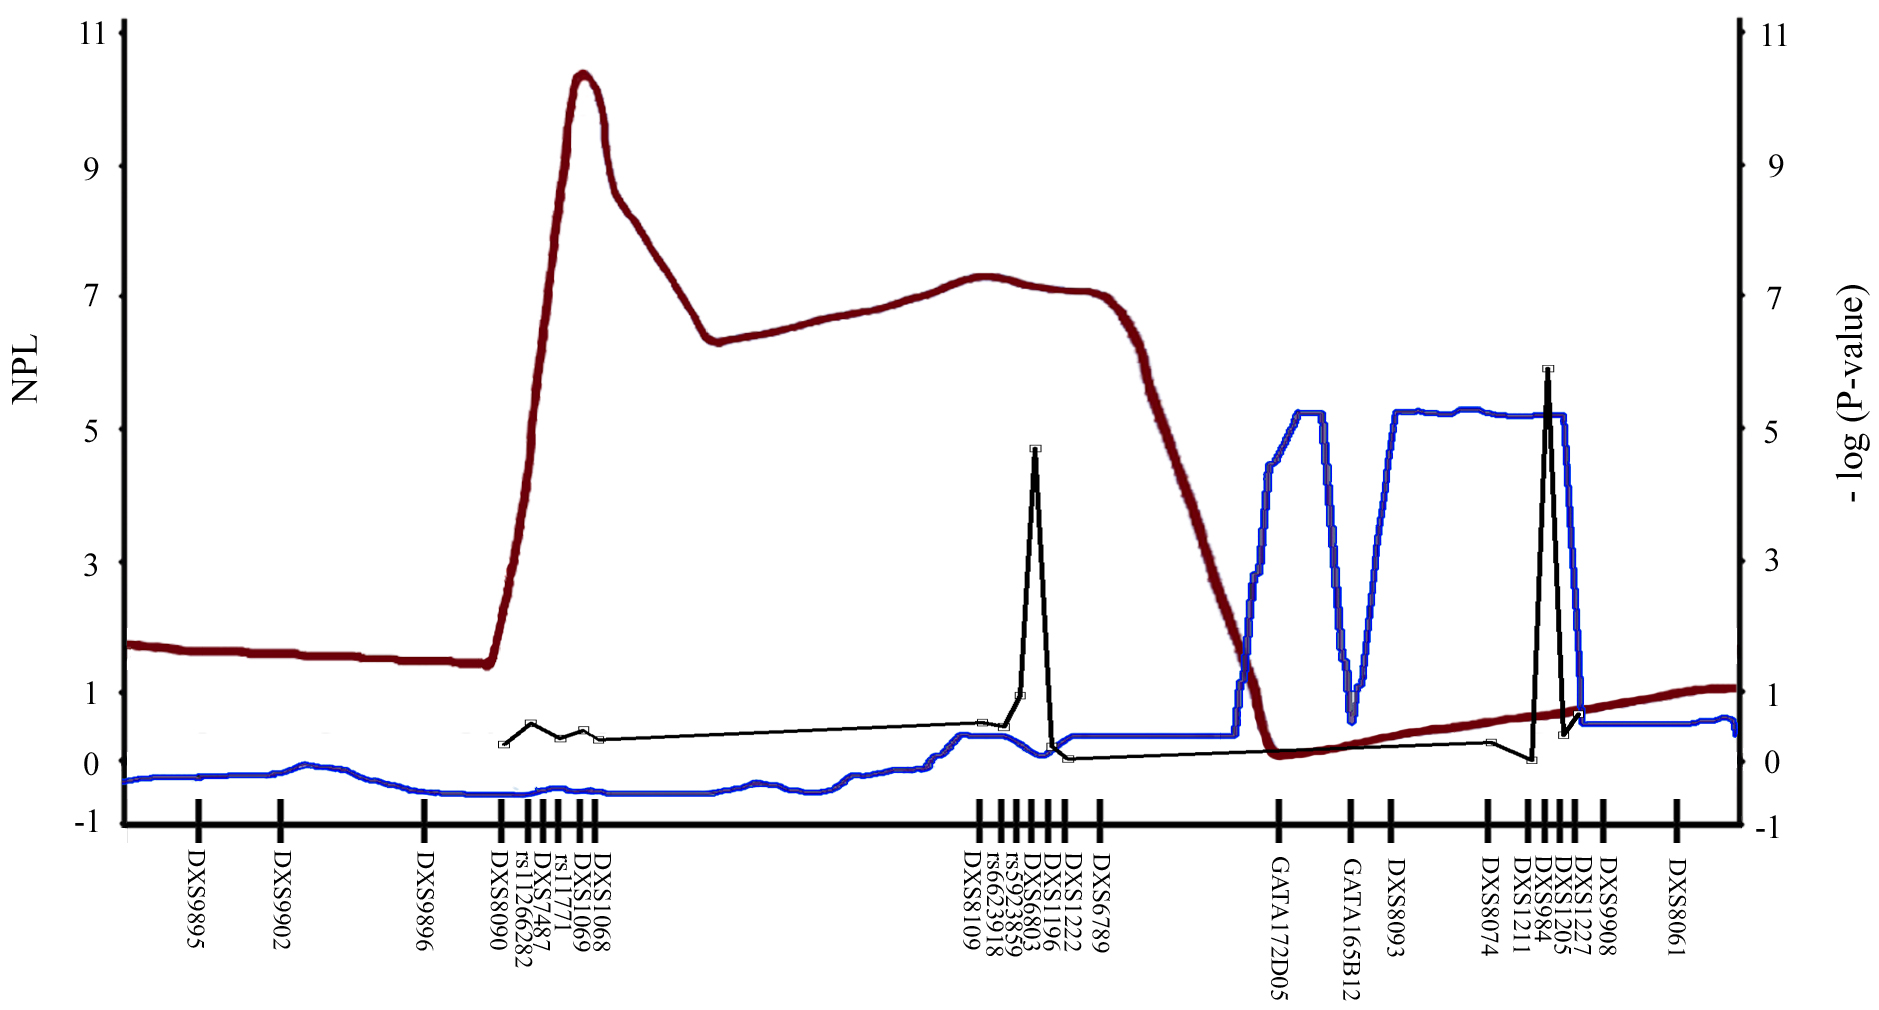
Figure 2. Ideogram of the modifier loci
for LHON on the X-chromosome. Auburn and blue lines show the results of
Hudson et al. [
28]
and
Shankar et al. [
29],
respectively,
where the nonparametric linkage score (NPL) is listed on
the left vertical axis. Black line shows the results of our study,
where the –log (p value) on the right vertical axis.
 Figure 2 of Ji, Mol Vis 2010; 16:416-424.