Figure 8. Phosphorylated p38 protein
content in the retinal arteries and neuroretina. Data are presented as
mean optical density (A and B) and representative
western blots (C and D) from animals subjected to
ischemia and 5 (n=4), 12 (n=8), or 20 (n=5) h of reperfusion (I-R) and
their corresponding sham-operated eyes. Note that there was no
difference in phosphorylated p38 (p-p38) expression between
sham-operated and ischemia-reperfusion eyes. Values are presented as
means±standard error of the mean. Statistical comparison was performed
using a paired Student ratio t test (ischemia versus
sham-operated eyes) with Bonferroni correction.
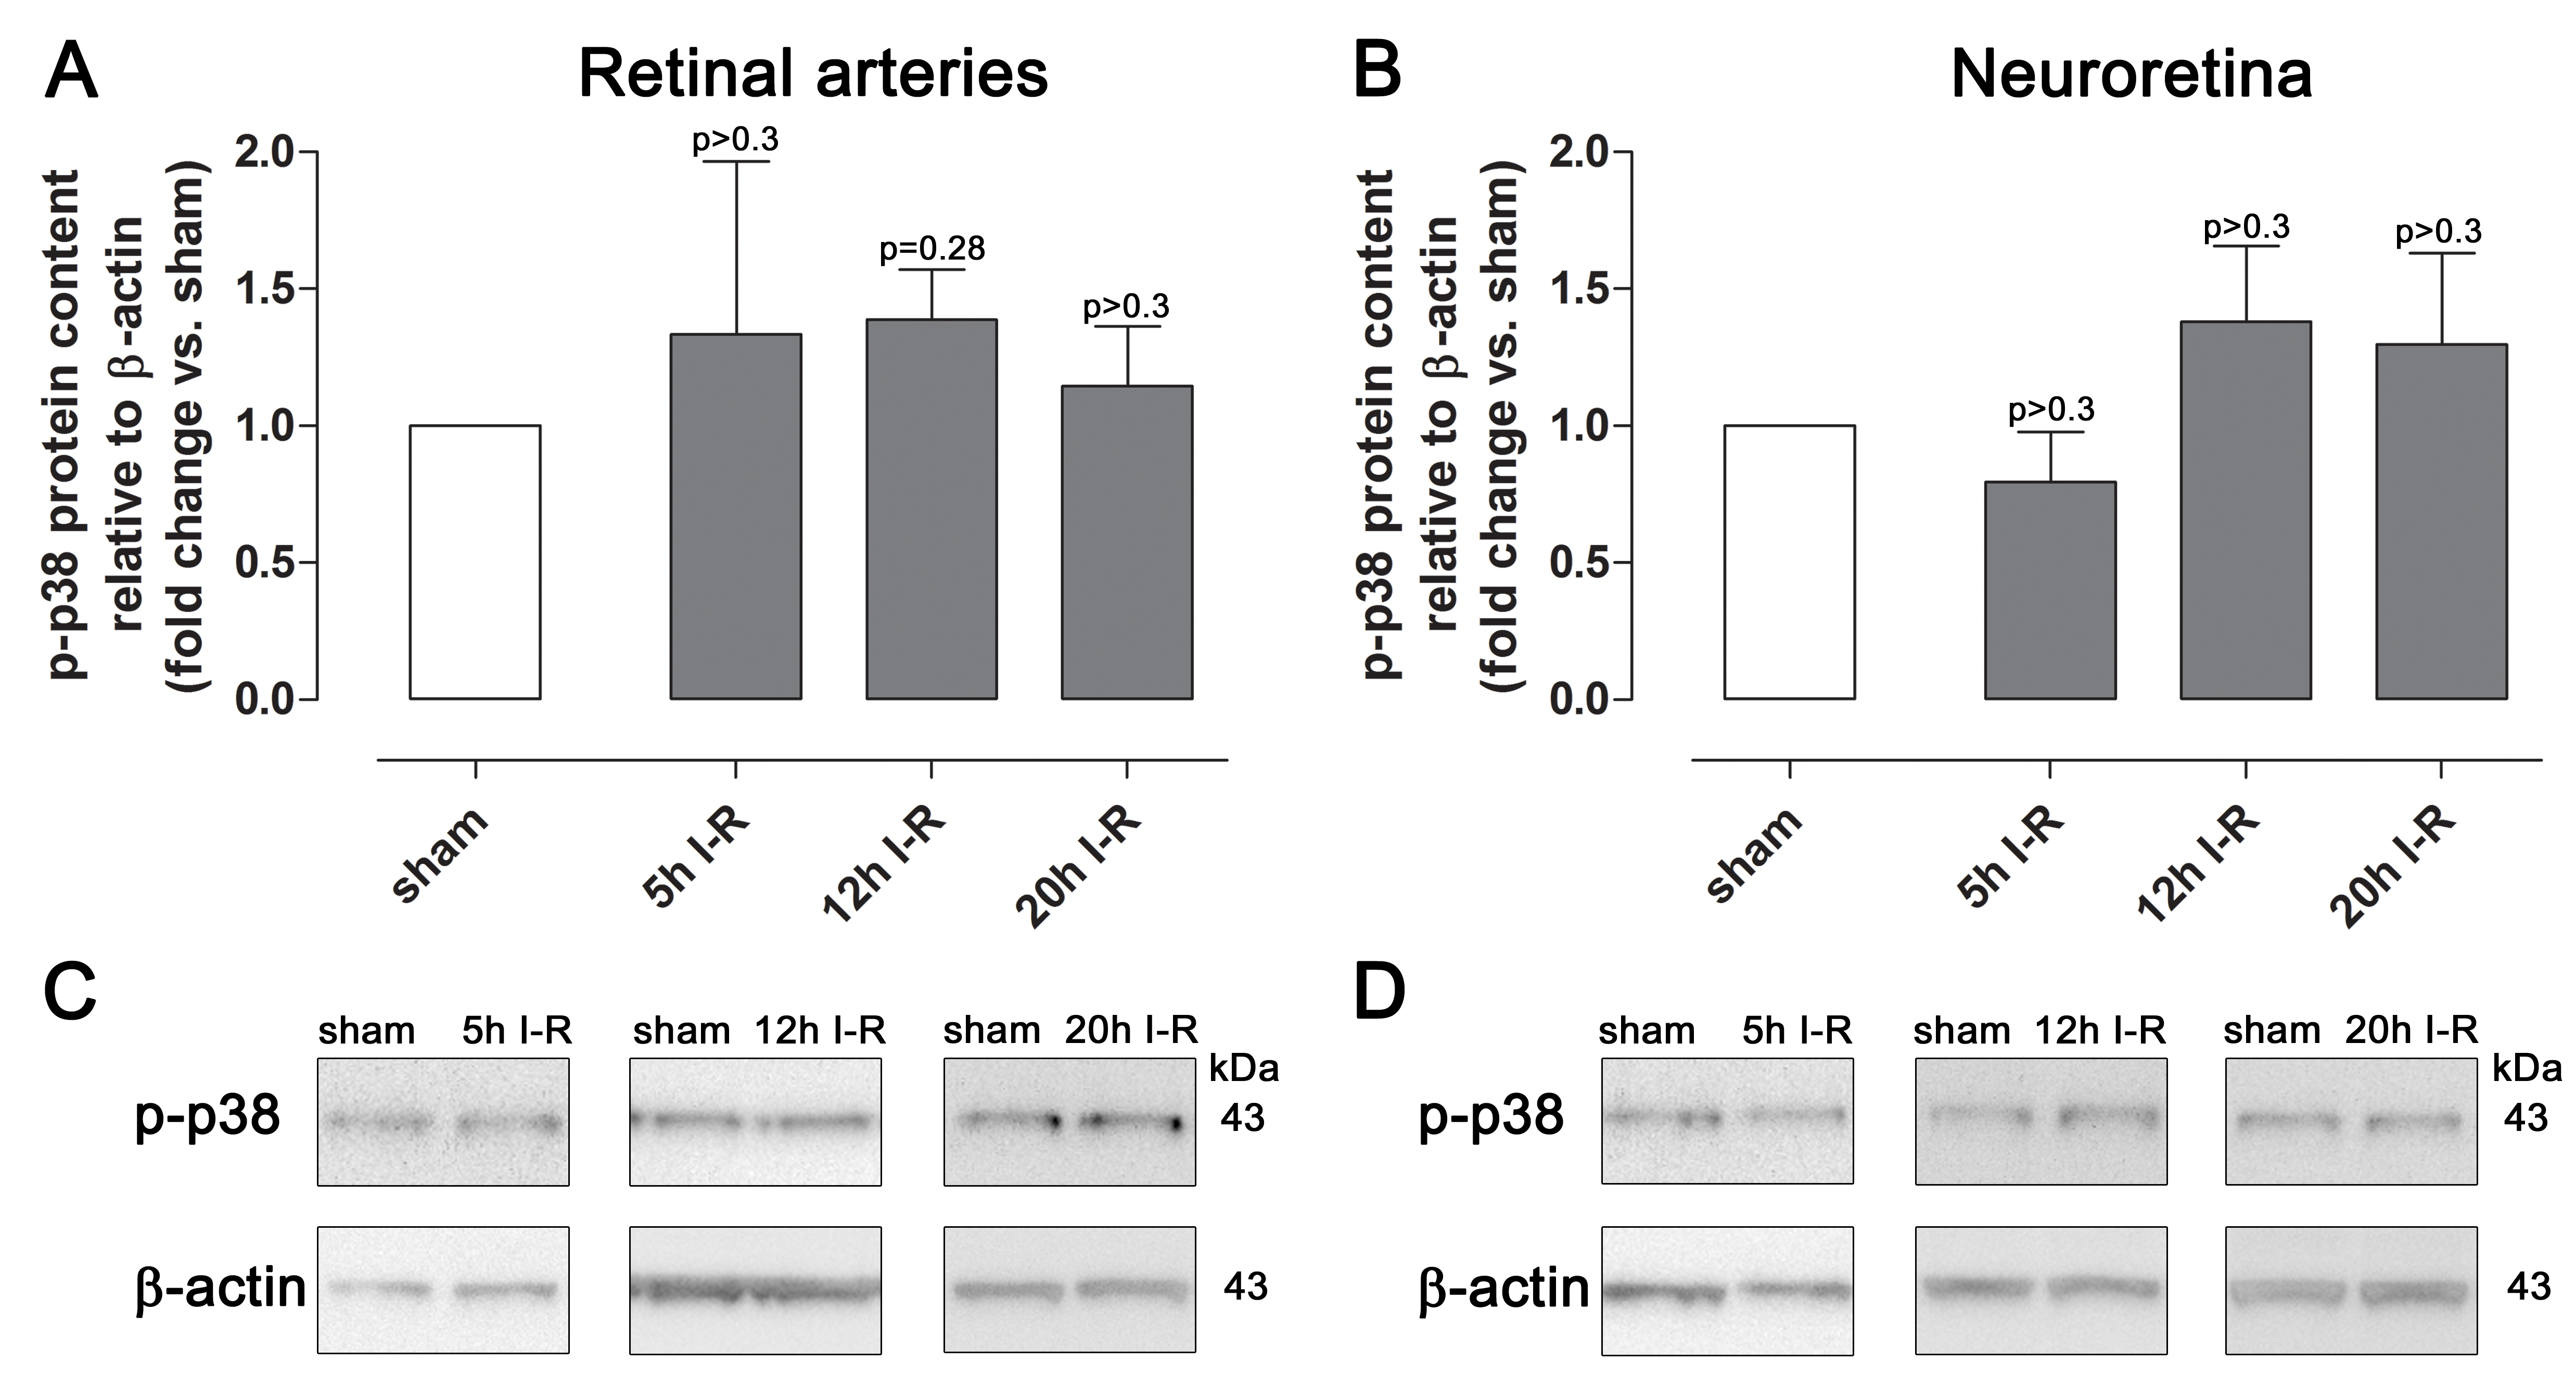
 Figure 8 of Gesslein, Mol Vis 2010; 16:392-407.