Figure 8 of
Sato, Mol Vis 2010; 16:378-391.
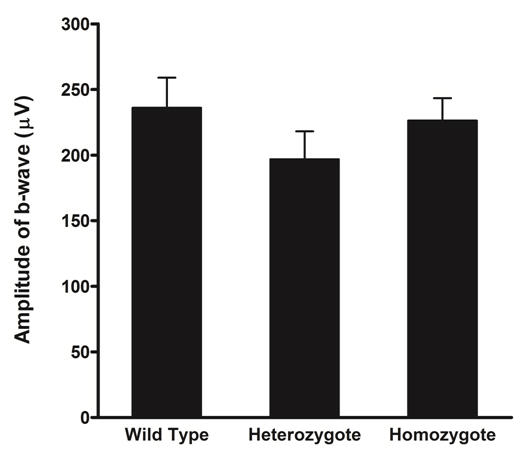
Figure 8.
Photopic electroretinograms of 7-week-old
Rom1
+/+
,
Rom1
Rgsc1156/+
, and
Rom1
Rgsc1156/Rgsc1156
mice (n=4 each). There were no significant differences in amplitude of the b-wave among the genotypes. Data shown are means±standard error.
 Figure 8 of
Sato, Mol Vis 2010; 16:378-391.
Figure 8 of
Sato, Mol Vis 2010; 16:378-391.