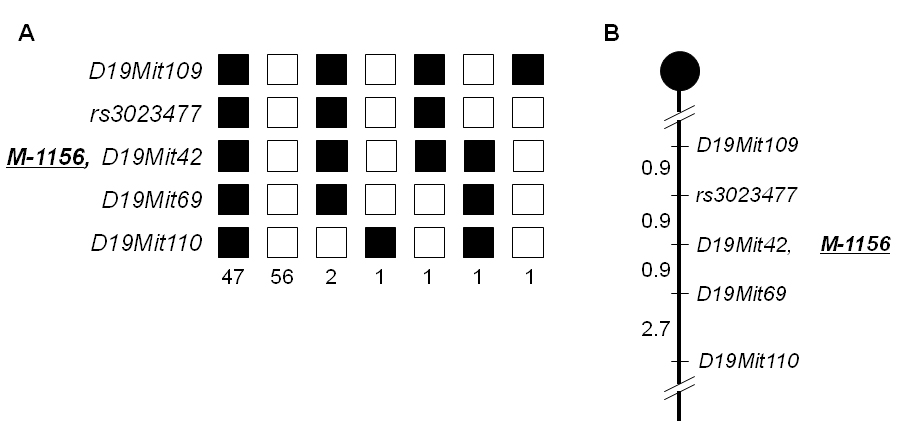
Figure 2. Haplotype analysis and genetic map of
M-1156.
A: Haplotype analysis of 109 backcross (N2) progeny from crossing
M-1156 and DBA/2J was shown. Genetic markers are listed on the left side (
rs3023477 is a single nucleotide polymorphism [
dbSNP]). Each column represents a chromosomal haplotype identified in the progeny. C57BL/6J alleles are indicated by black boxes,
and DBA/2J alleles are indicated by white boxes.
M-1156 denotes the mutant locus.
B: Genetic map around the causative gene was shown. The map distances (in cM) are shown on the left side of the map. The mutant
locus
M-1156 was mapped close to D19Mit42 on mouse chromosome 19.
 Figure 2 of
Sato, Mol Vis 2010; 16:378-391.
Figure 2 of
Sato, Mol Vis 2010; 16:378-391.