Figure 7. Distribution analysis of mid-infrared spectra derived from the three putative regions (stem cell, transit-amplifying cell,
and terminally-differentiated cell) of human cornea. A: Percentage histograms for stem cells (SCs), transit-amplifying (TA) cells, and terminally differentiated (TD) cells×all
wavenumbers put together in a three-dimensional form, where selected wavenumbers have been indicated. B: Mid-infrared spectral map showing absorbance for wavenumber 1,080 cm−1; and, C: specific histograms for selected wavenumbers suggested to be associated with marked class discrimination.
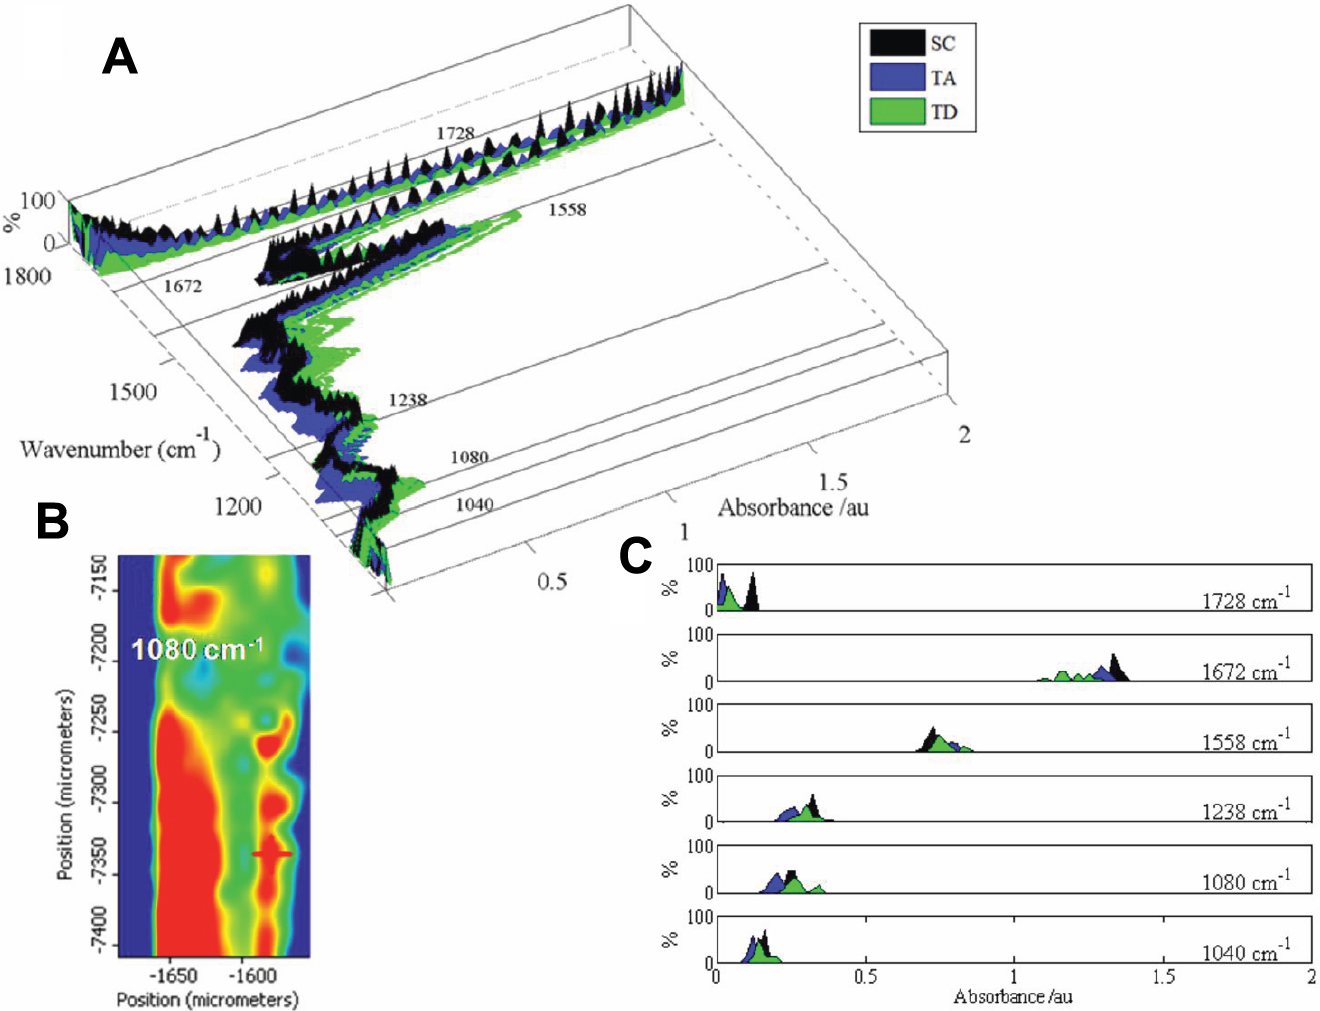
 Figure 7 of
Nakamura, Mol Vis 2010; 16:359-368.
Figure 7 of
Nakamura, Mol Vis 2010; 16:359-368.