Figure 6. Spectral image maps of infrared absorbance at wavenumbers (cm−1) chosen to highlight the three putative regions (stem cell, transit-amplifying cell, and terminally-differentiated cell)
of human cornea. A: An unstained cryosection of corneal limbus from which the maps were taken. The red rectangle shows the precise area from
which the mid-infrared (IR) spectral map was acquired. The dotted red line shows the approximate location of the basal limbal
stem cells. The green line indicates the superficial epithelium. B: The limbal region immunolabeled with a green fluorescent marker (keratin 15) for corneal SCs. The cell nuclei have been
stained with DAPI (4',6-diamidino-2-phenylindole; blue), and the basement membrane has been immunolabeled for laminin (red).
C: Mid-IR spectral map showing absorbance for 1,040 cm−1; D: mid-IR spectral map showing absorbance for 1,107 cm−1; E: mid-IR spectral map showing absorbance for 1,225 cm−1; F: mid-IR spectral map showing absorbance for 1,400 cm−1; G: mid-IR spectral map showing absorbance for 1,525 cm−1; H: mid-IR spectral map showing absorbance for 1,558 cm−1; and I: mid-IR spectral map showing absorbance for 1,728 cm−1.
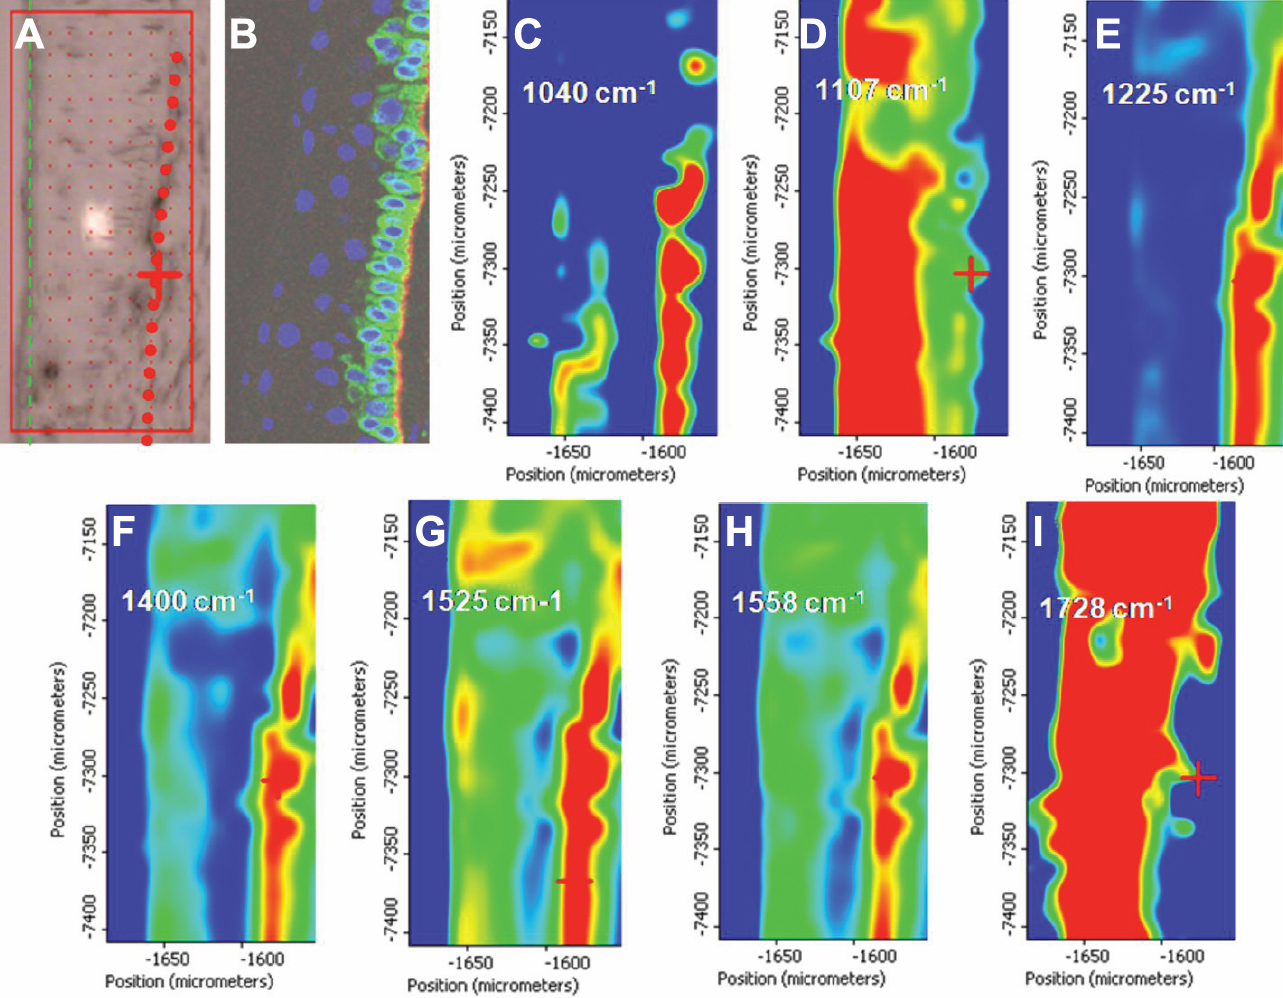
 Figure 6 of
Nakamura, Mol Vis 2010; 16:359-368.
Figure 6 of
Nakamura, Mol Vis 2010; 16:359-368.