Figure 5. Two-class discrimination using principal component analysis over the biologically relevant spectral region (1,800–900 cm−1) derived from the three putative regions (stem cell [SC], transit-amplifying [TA] cell, and terminally-differentiated [TD]
cell). Principal component analysis scores and loading plots of A and B SCs versus TA cells; C and D SCs versus TD cells; and E and F TA cells versus TD cells. Cell-specific clusters show good two-class discrimination (A,C,E), and the respective loadings plots (B,D,F) demonstrate major biomarker differences along chosen linear coordinates (i.e., principal components [PCs]).
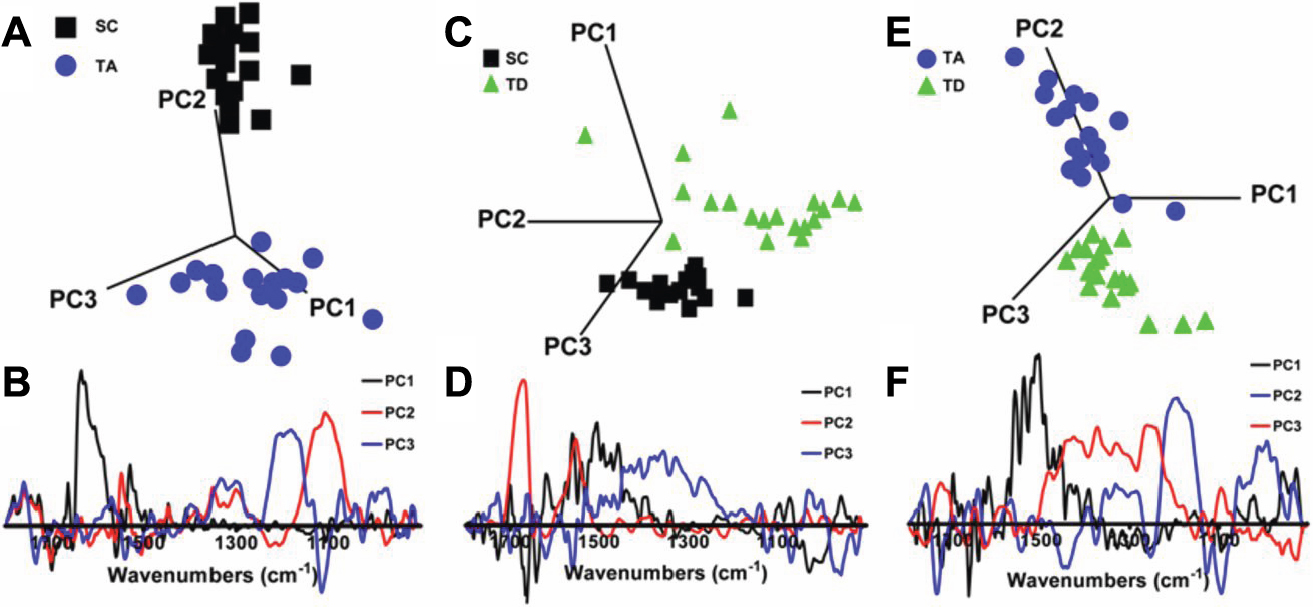
 Figure 5 of
Nakamura, Mol Vis 2010; 16:359-368.
Figure 5 of
Nakamura, Mol Vis 2010; 16:359-368.