Figure 4. Principal component analysis of point mid-infrared spectra over the biologically relevant spectral region (1,800–900 cm−1) derived from the three putative regions (stem cell, transit-amplifying cell, and terminally-differentiated cell). A: The principal component analysis scores plots of stem cell (SC) versus transit-amplifying (TA) cell versus terminally differentiated
(TD) cell shows good separation of the three cell populations with a small degree of overlap. B: The resultant loadings plot identifies the biomarker differences (i.e., discriminating wavenumbers) over the spectral range.
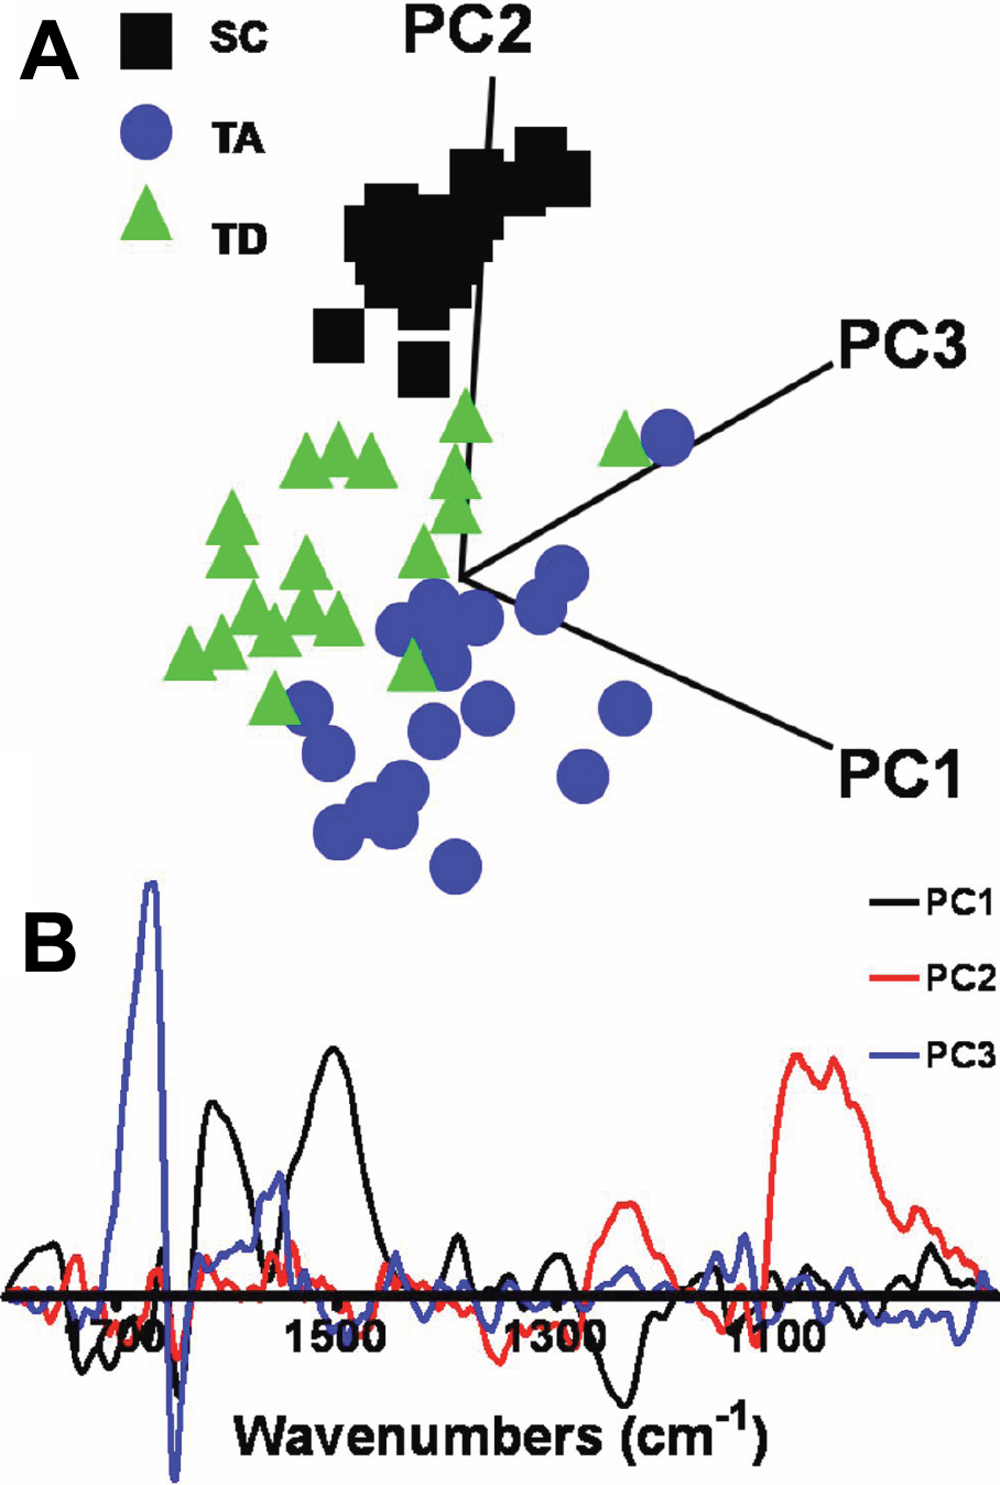
 Figure 4 of
Nakamura, Mol Vis 2010; 16:359-368.
Figure 4 of
Nakamura, Mol Vis 2010; 16:359-368.