Figure 2. Phenotypic characterization of
two members of a Dutch family. A: The upper portion presents
the visual field printouts of the Goldmann perimetry (GP) test, and the
lower part shows screenshots from Heidelberg Retina Tomograph II (HRT).
The right and left column correspond to the right and left eye of
individual IV:2, respectively. The small temporal black area in the GP
corresponds to the physiologic blind spot. HRT scans demonstrate a
physiologic optic disc cupping measure (red areas) and a physiologic
thinned neuroretinal rim (blue-green area) of the optic disc. B:
GP
and HRT results for III:3 are shown. The large dark areas in the GP
correspond to the enlarged blind spot due to optic neuropathy. HRT
scans demonstrate increased optic disc cupping measure (red areas) and
a thinned neuroretinal rim (blue-green area) of the optic disc.
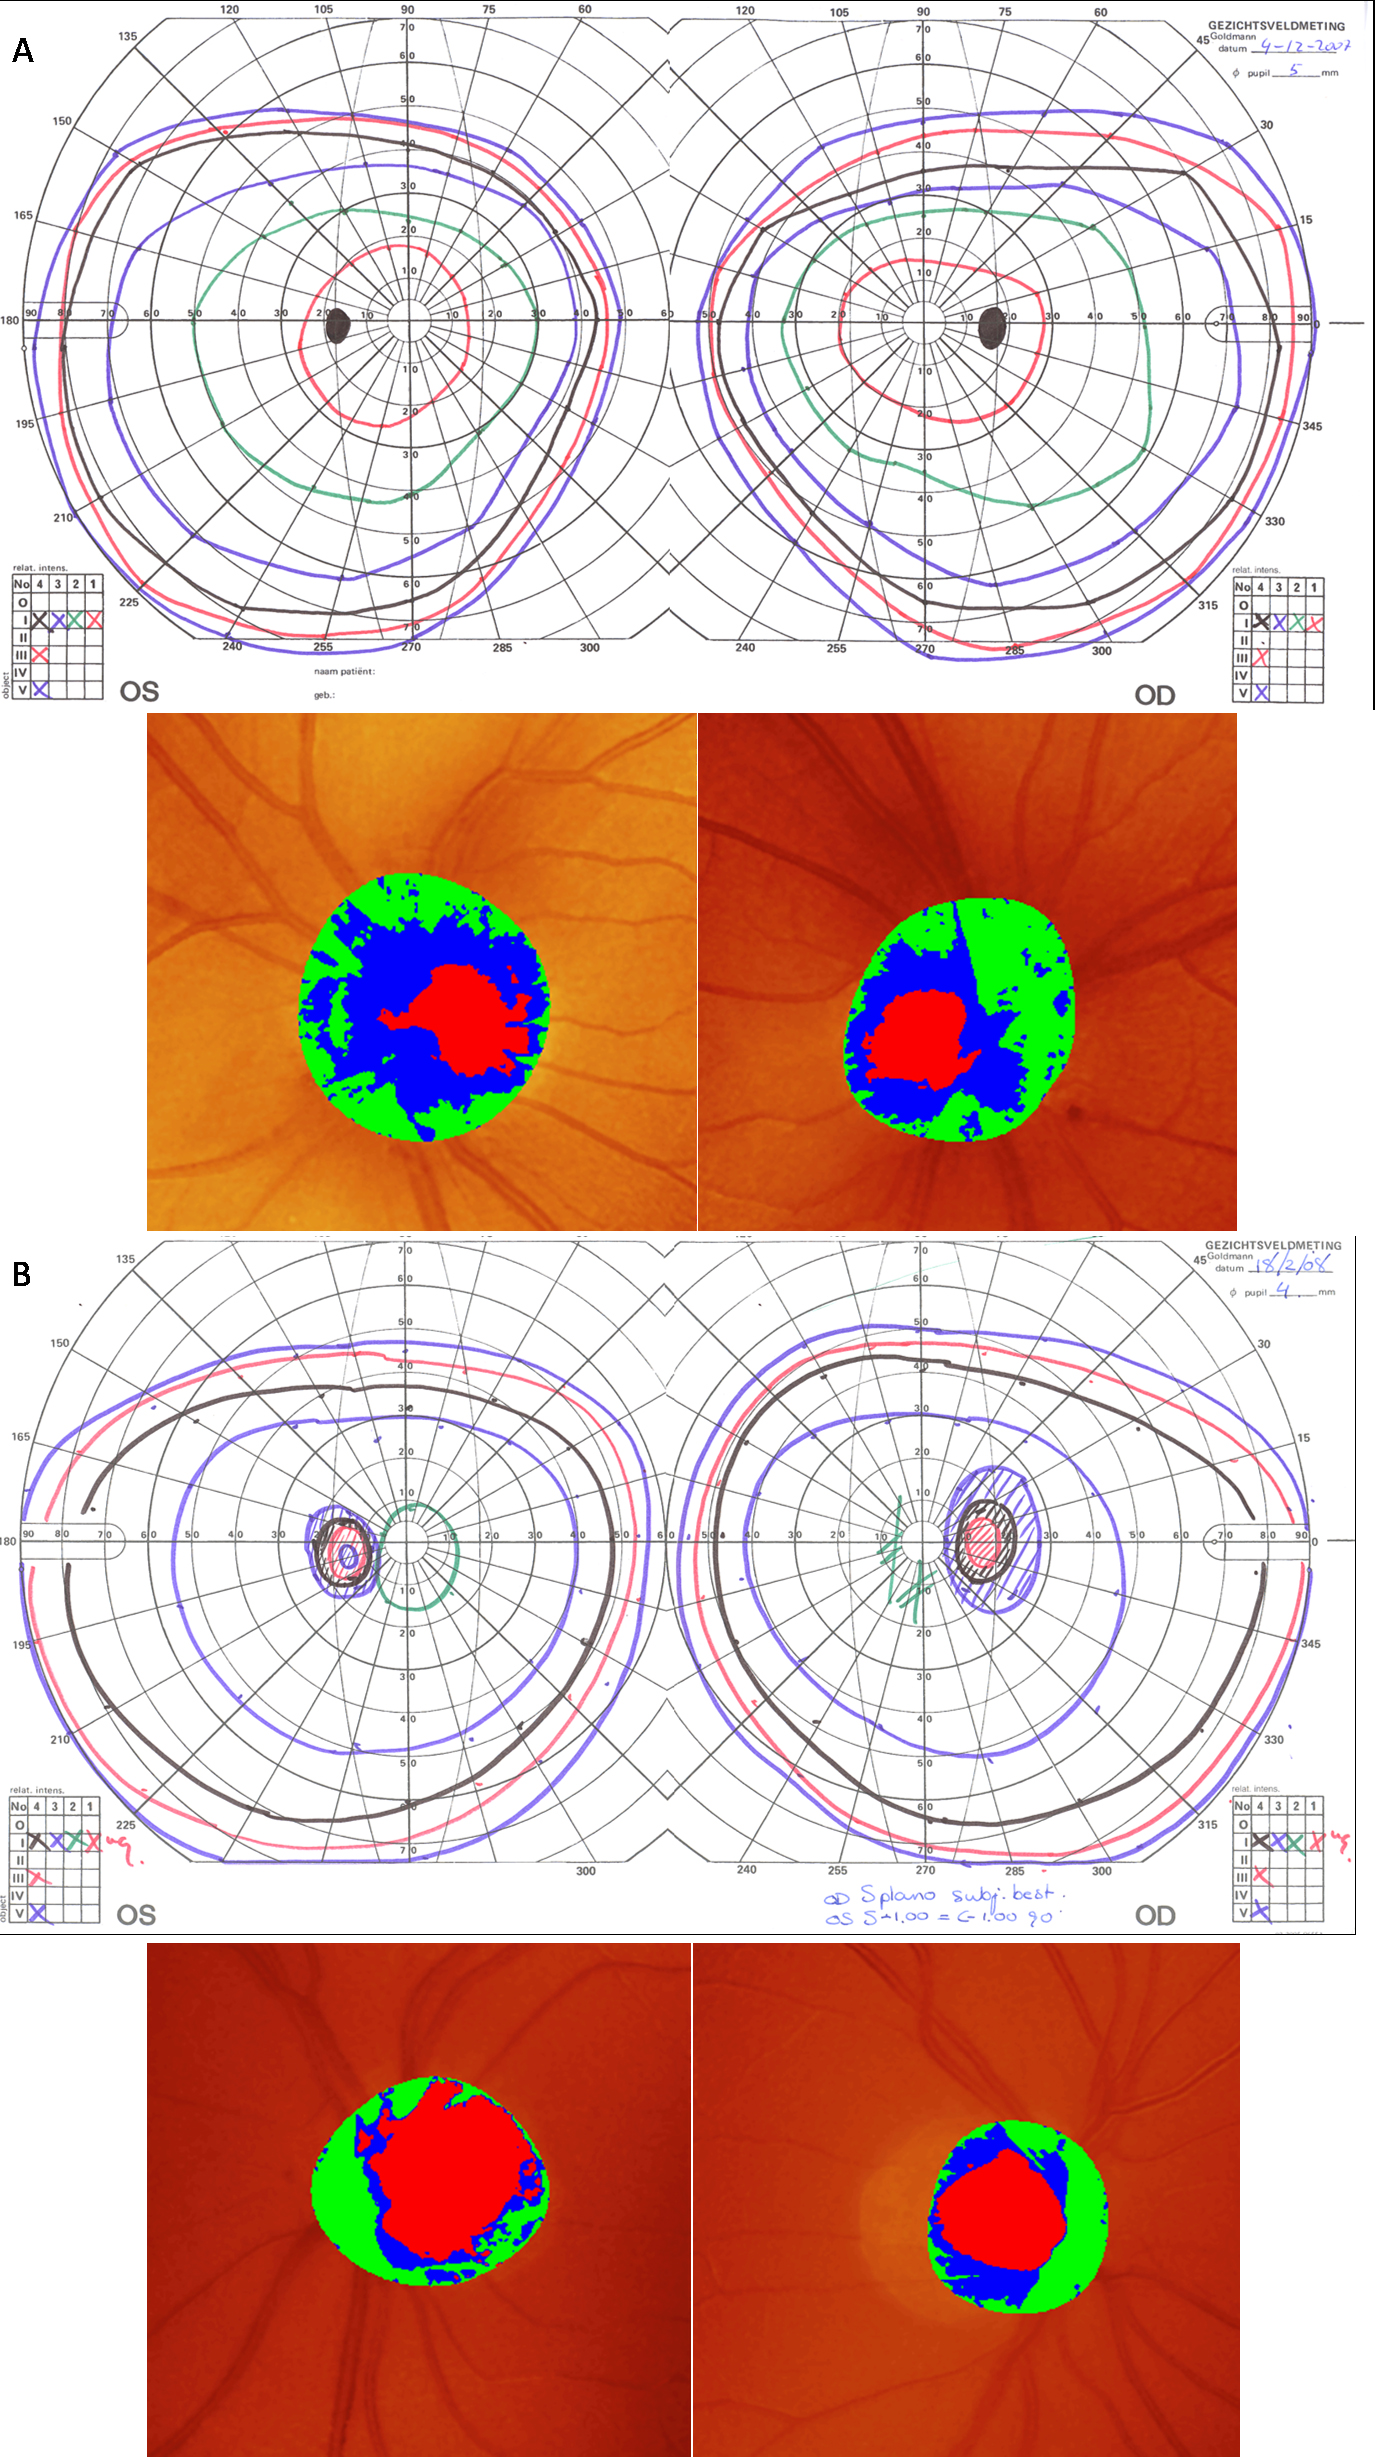
 Figure 2 of Hogewind, Mol Vis 2010; 16:26-35.