Figure 4. Optic nerve crush induced novel
changes in AQP9 protein and mRNA levels. AQP9 protein levels showed
opposite trend to changes in mRNA where they increased at 7 day
(174±27%, p<0.001 versus control, A, n=6) but decreased at 2
and 14 day (38±19%, 50±13%, at 2, and 14 day, respectively, A,
n=8). AQP9 shows a doublet and both bands were used in densitometric
quantification in B. Data are expressed as a ratio of the
control value and each measurement represents mean±SEM *Denote
statistical significance of AQP9 protein levels in optic nerve crushed
retinas versus sham (p<0.005) as determined by one-way ANOVA and
Tukey multiple comparison test. Optic AQP9 transcripts were
quantified by quantitative real-time PCR (B). Gene expression
data of AQP9 is calculated after normalizing with ACTB.
AQP9 mRNA increased at 2 and 14 day (150±30%, 200±30%, at 2, and
14 day, respectively, n=5) but decreased at 7 day (44±13%, n=6, B).
**Denote
significant differences compared with sham-retinas at
p<0.05. Abbreviations: sham eye (C), and crushed (R).
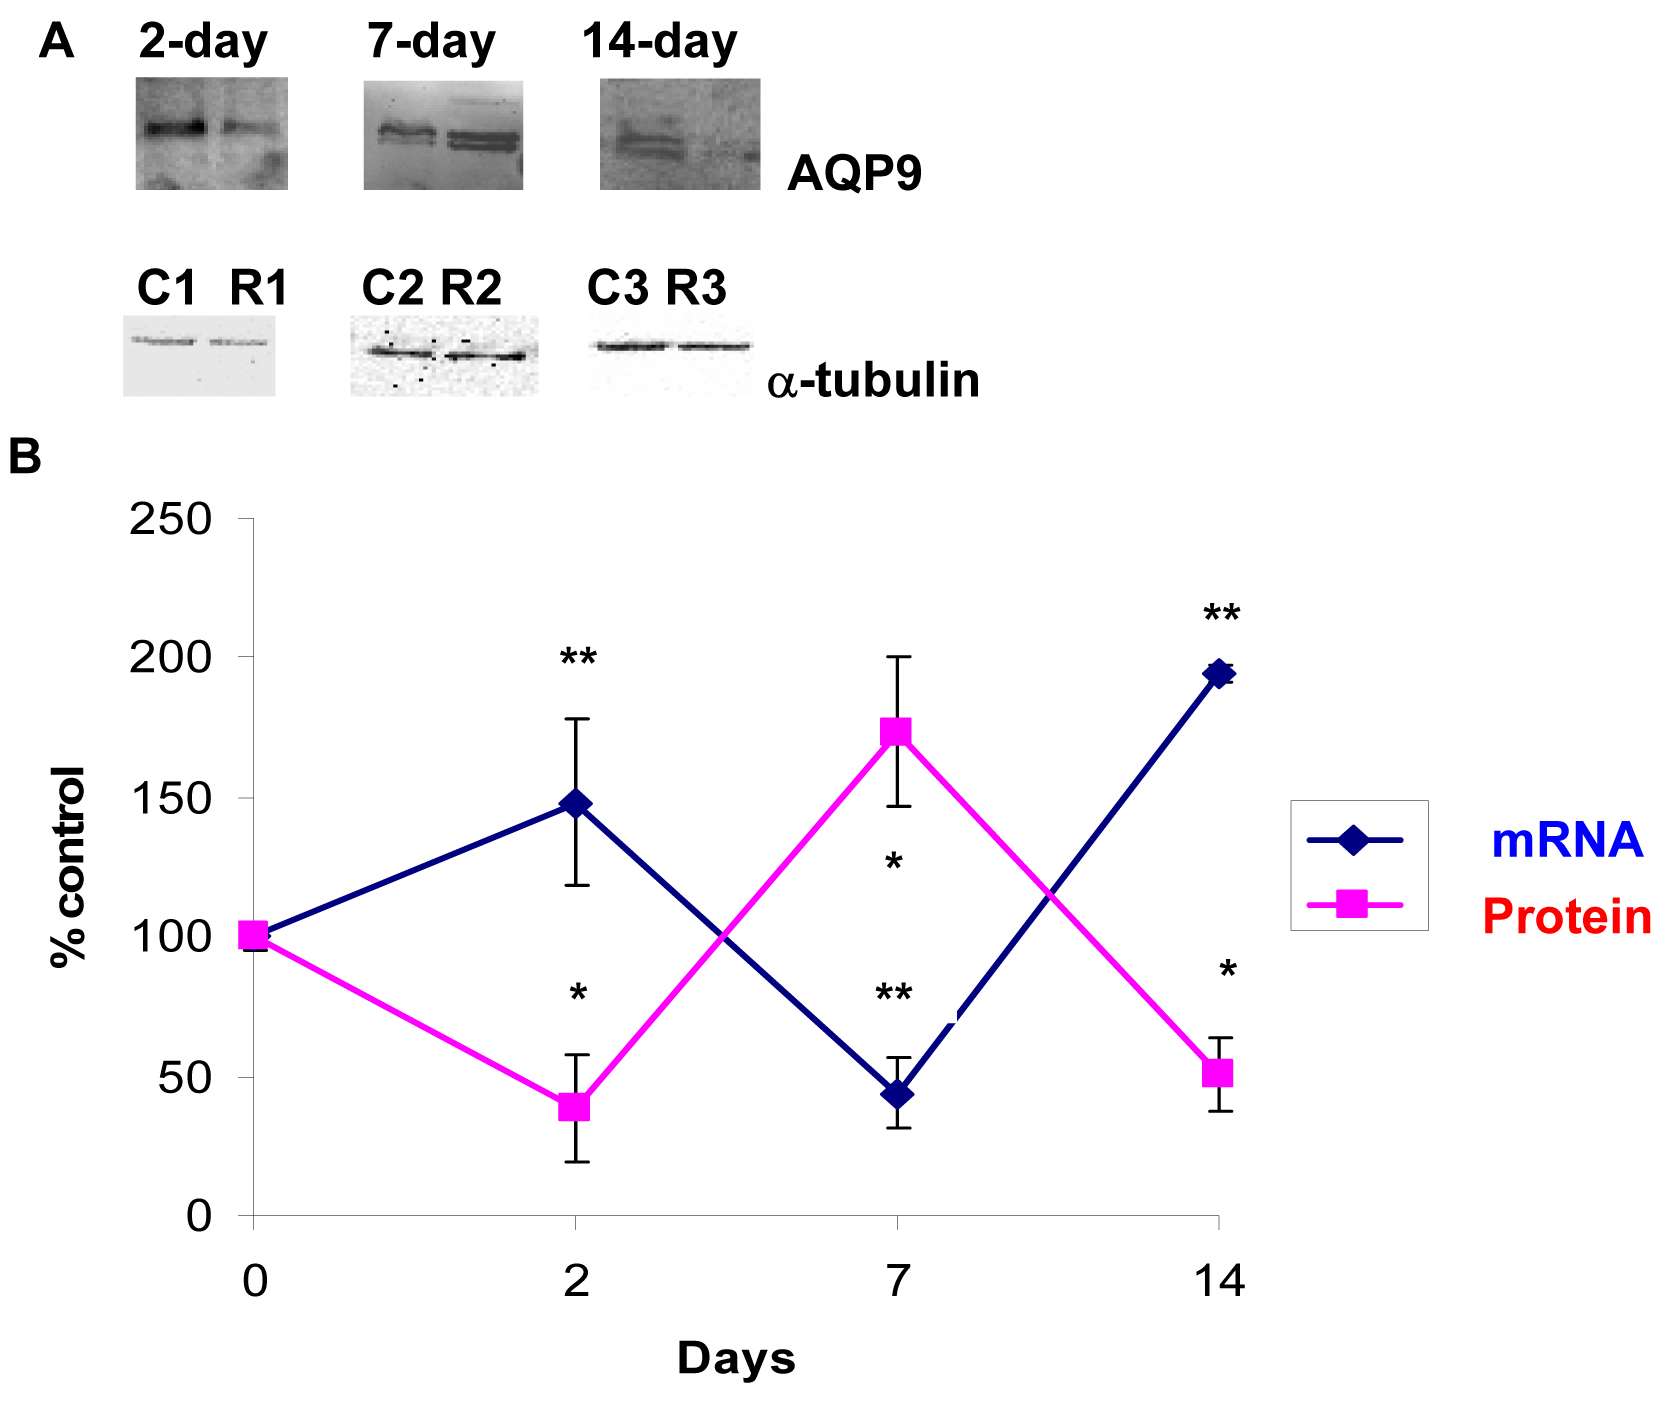
 Figure 4 of Dibas, Mol Vis 2010; 16:330-340.