Figure 6. Comparison of endothelial cell
volumes within laser-induced lesion sites in choroids of control and
neuroprotecin D1 (NPD1)-treated mice. Image stacks were obtained
through each laser lesion by confocal microscopy, and all voxels from
the isolectin B4-labeled endothelial cell channel with intensities
above threshold were summed for each layer. All layers throughout the
stack were then summed to give the total number of endothelial cell
voxels per lesion at 7 and 14 days following laser treatment. Volumes
were calculated by multiplying the total number of voxels by the voxel
dimension (0.45 µm×0.45 µm×0.45 µm). These volumes are represented by
the black (control) and white (NPD1-treated) bars. Asterisks denote
level of statistical significance as compared to vehicle (*p<0.05).
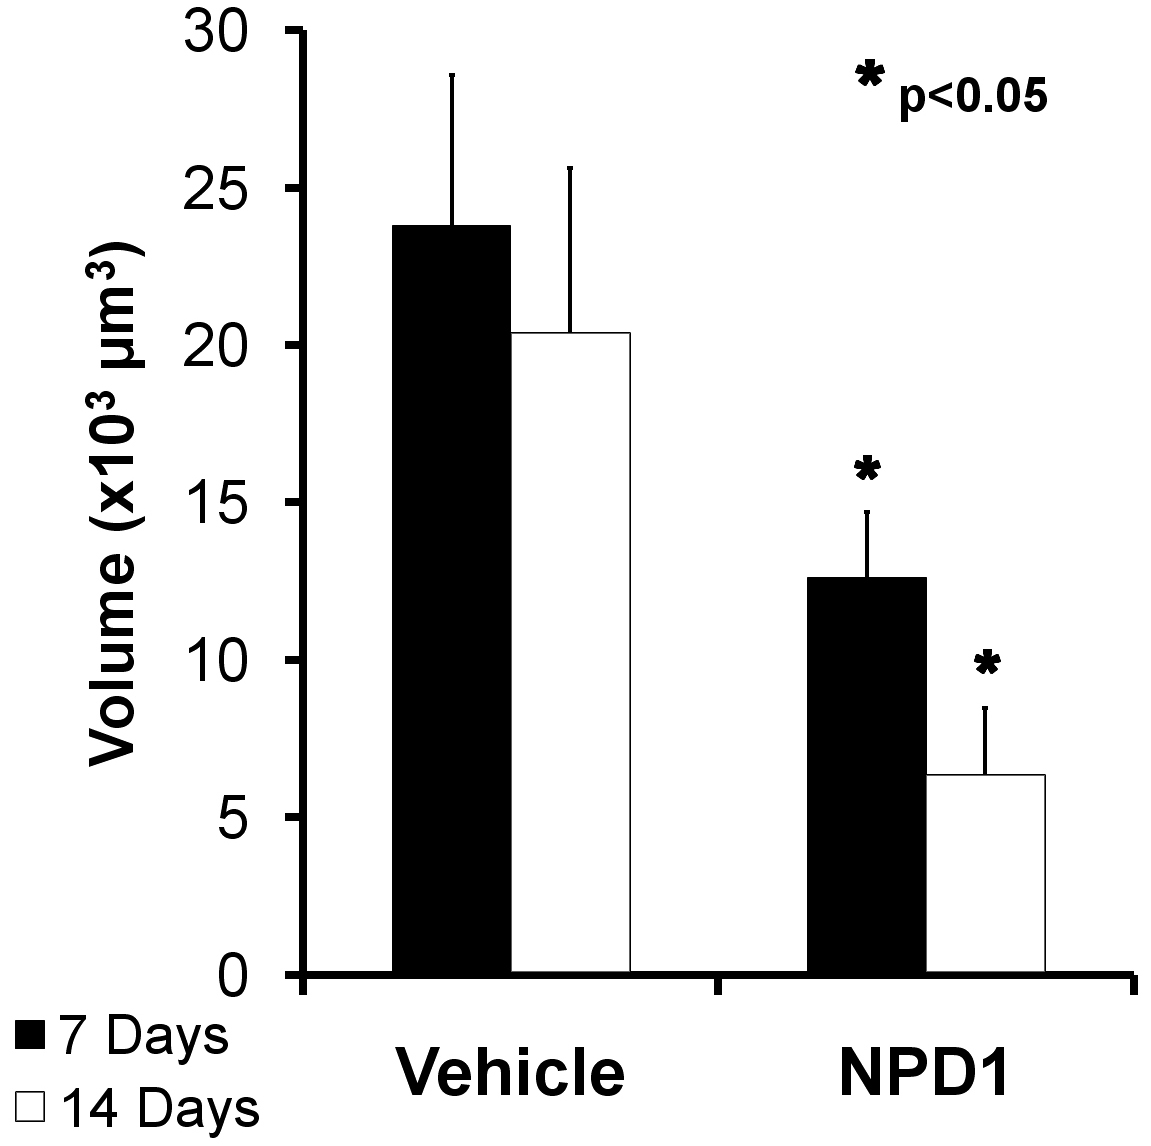
 Figure 6 of Sheets, Mol Vis 2010; 16:320-329.