Figure 4. Confocal microscopy of
laser-induced choroidal neovascularization (CNV), showing extent of
endothelial cell proliferation in control animals. A, B: In
this flatmount preparation of a control choroid at 7 days post
treatment, the retina has been removed to expose a typical laser lesion
through Bruch’s membrane and into the choriocapillaris. A:
Maximum projection (brightest voxel displayed for each Z-column) images
of immunolocalization for cytoskeleton (f-actin, green), nuclei
(Heochst, blue), and endothelial cells (isolectin B4, red) are shown on
the left, along with a merged image of the three labels. The initial
lesion (50 µm diameter) is apparent in the f-actin image, while
endothelial cells (capillaries) are seen to fill the site as
proliferation proceeds. B: The same lesion as in A,
presented as an orthogonal cut view. The large square image represents
a single layer in a confocal stack of images, as viewed above from the
retina, with the three labels merged. Lateral views of this image stack
are shown at the top and to the right; the blue line in these views
indicates the level within the stack of the view shown in the square.
The lateral view at the top is from the position of the green line in
the large square; the lateral view to the right is from the position of
the red line in the large square. C, D: Images are organized
the same as in A and B and depict a typical laser
lesion of a control retina at 14 days post treatment. White circles
represent the 50-µm-diameter initial laser lesion. Magnification bars
equal 50 µm.
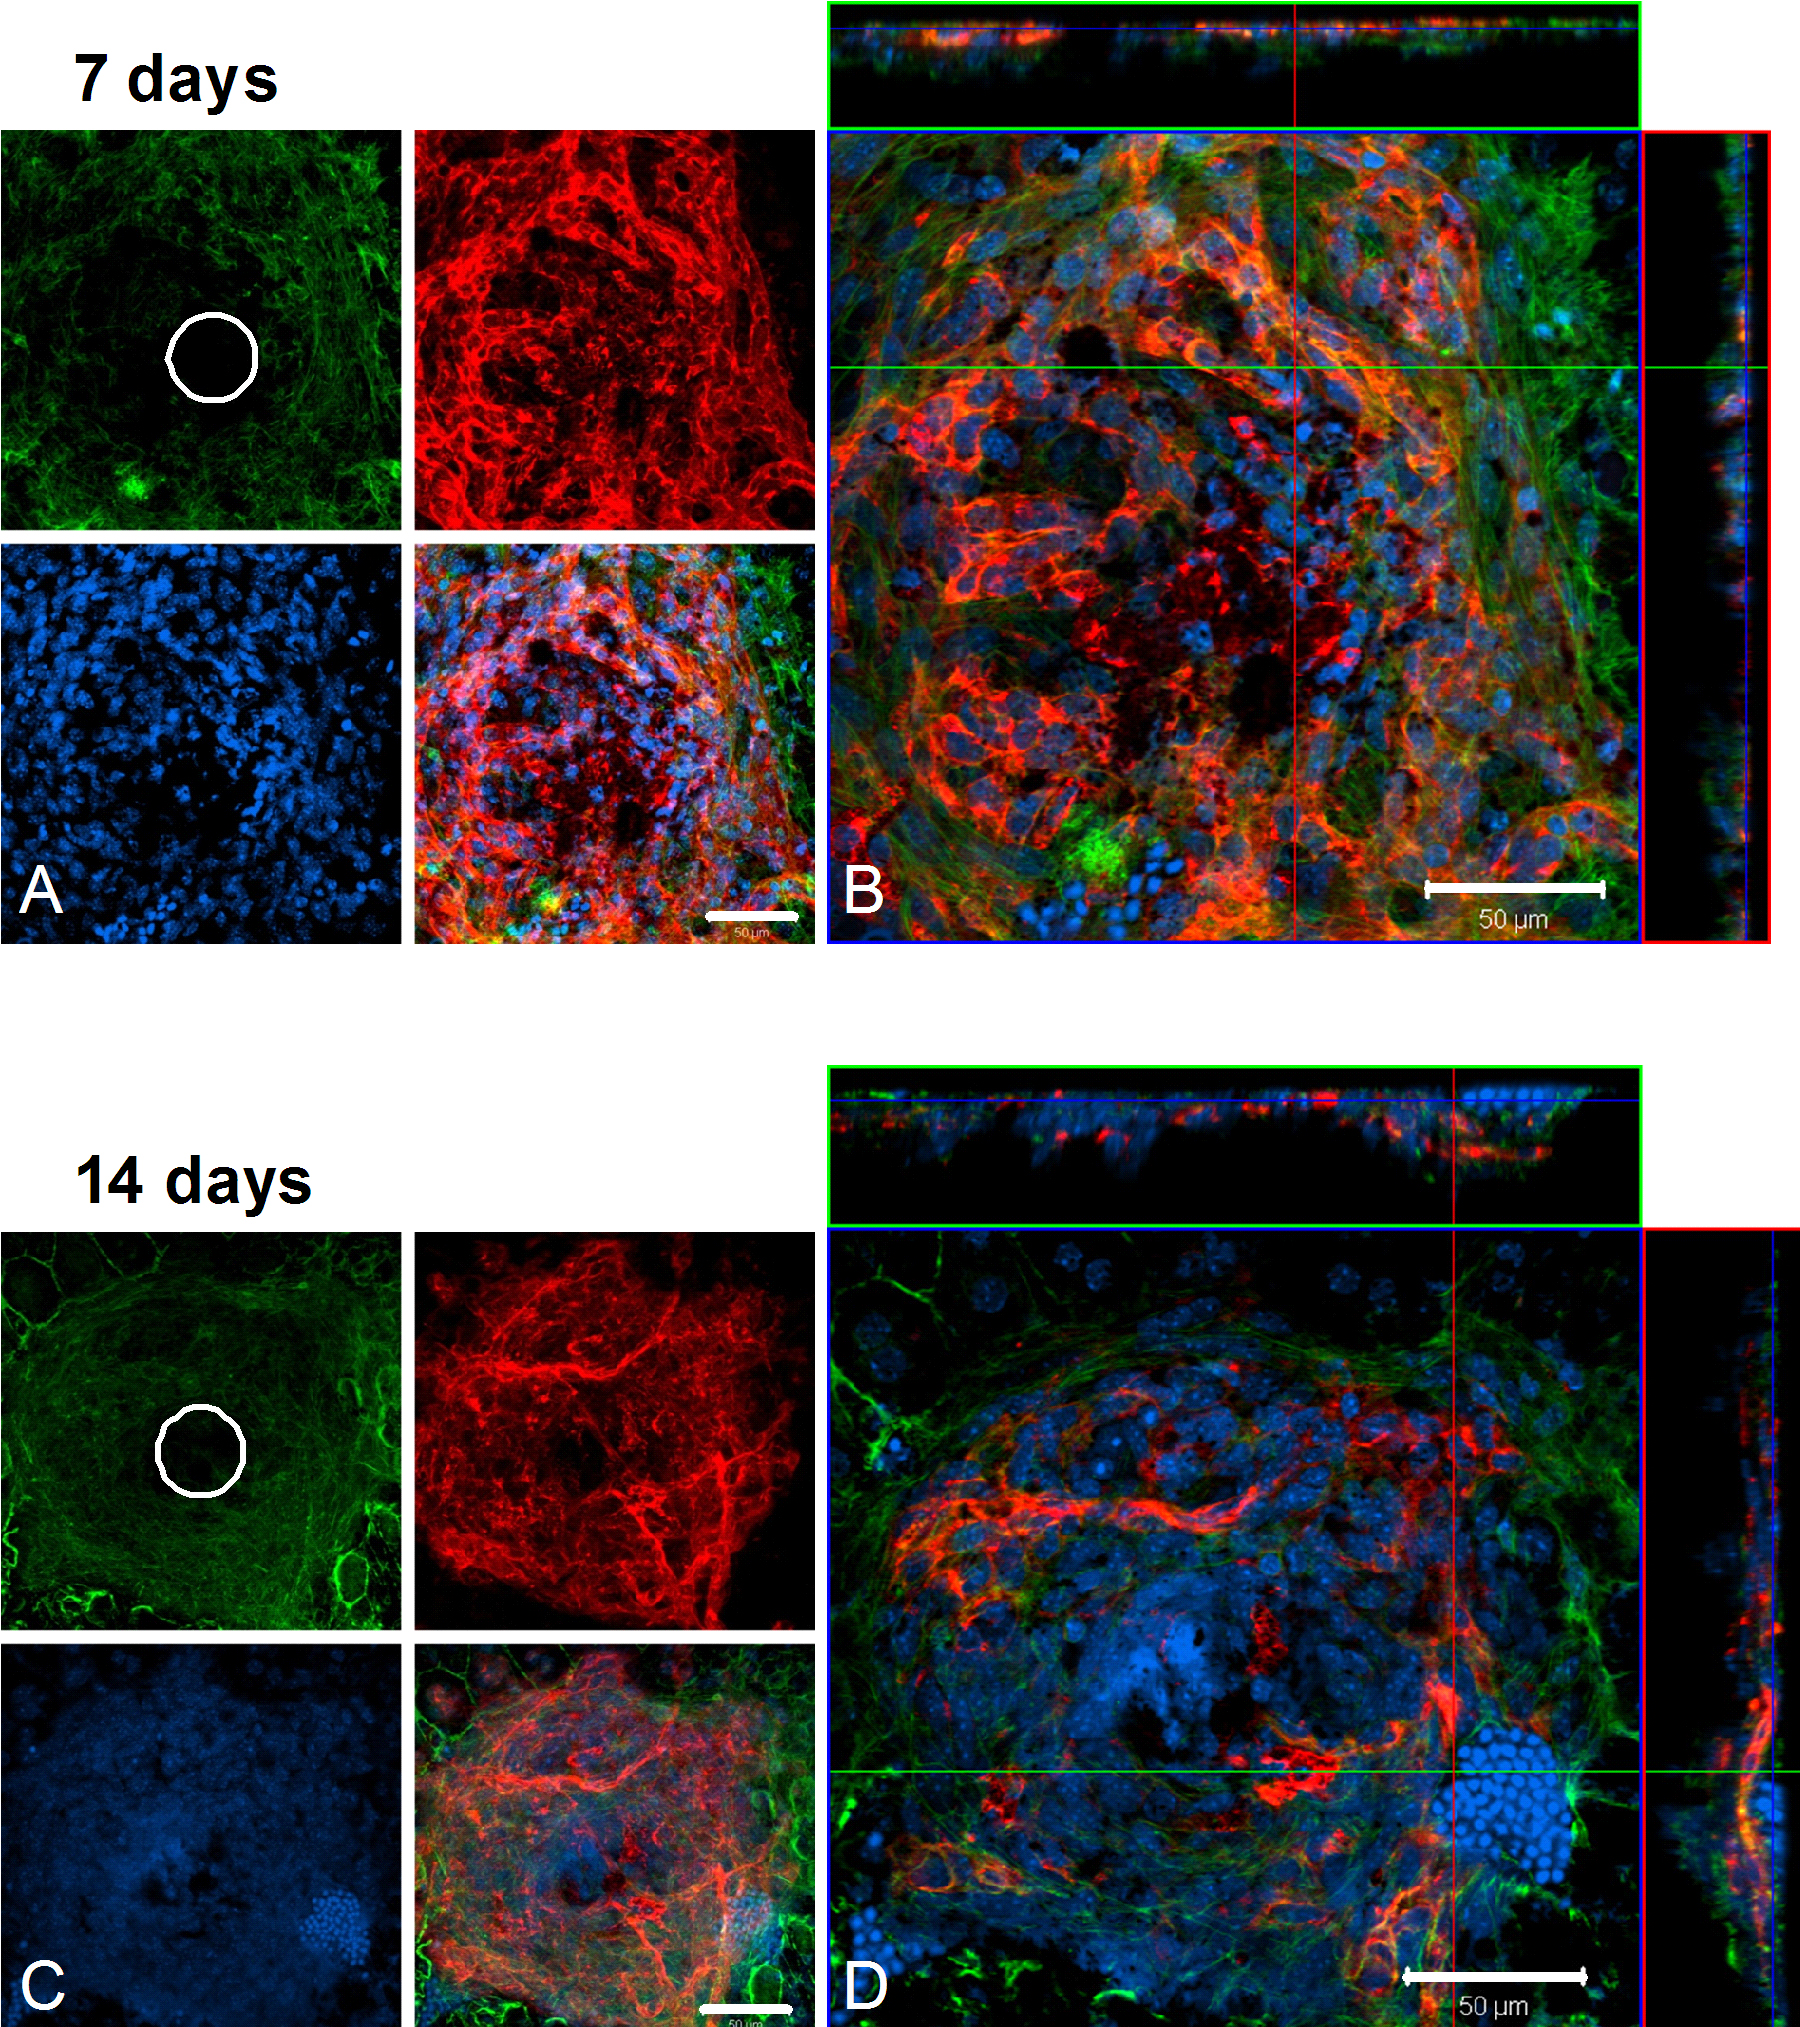
 Figure 4 of Sheets, Mol Vis 2010; 16:320-329.