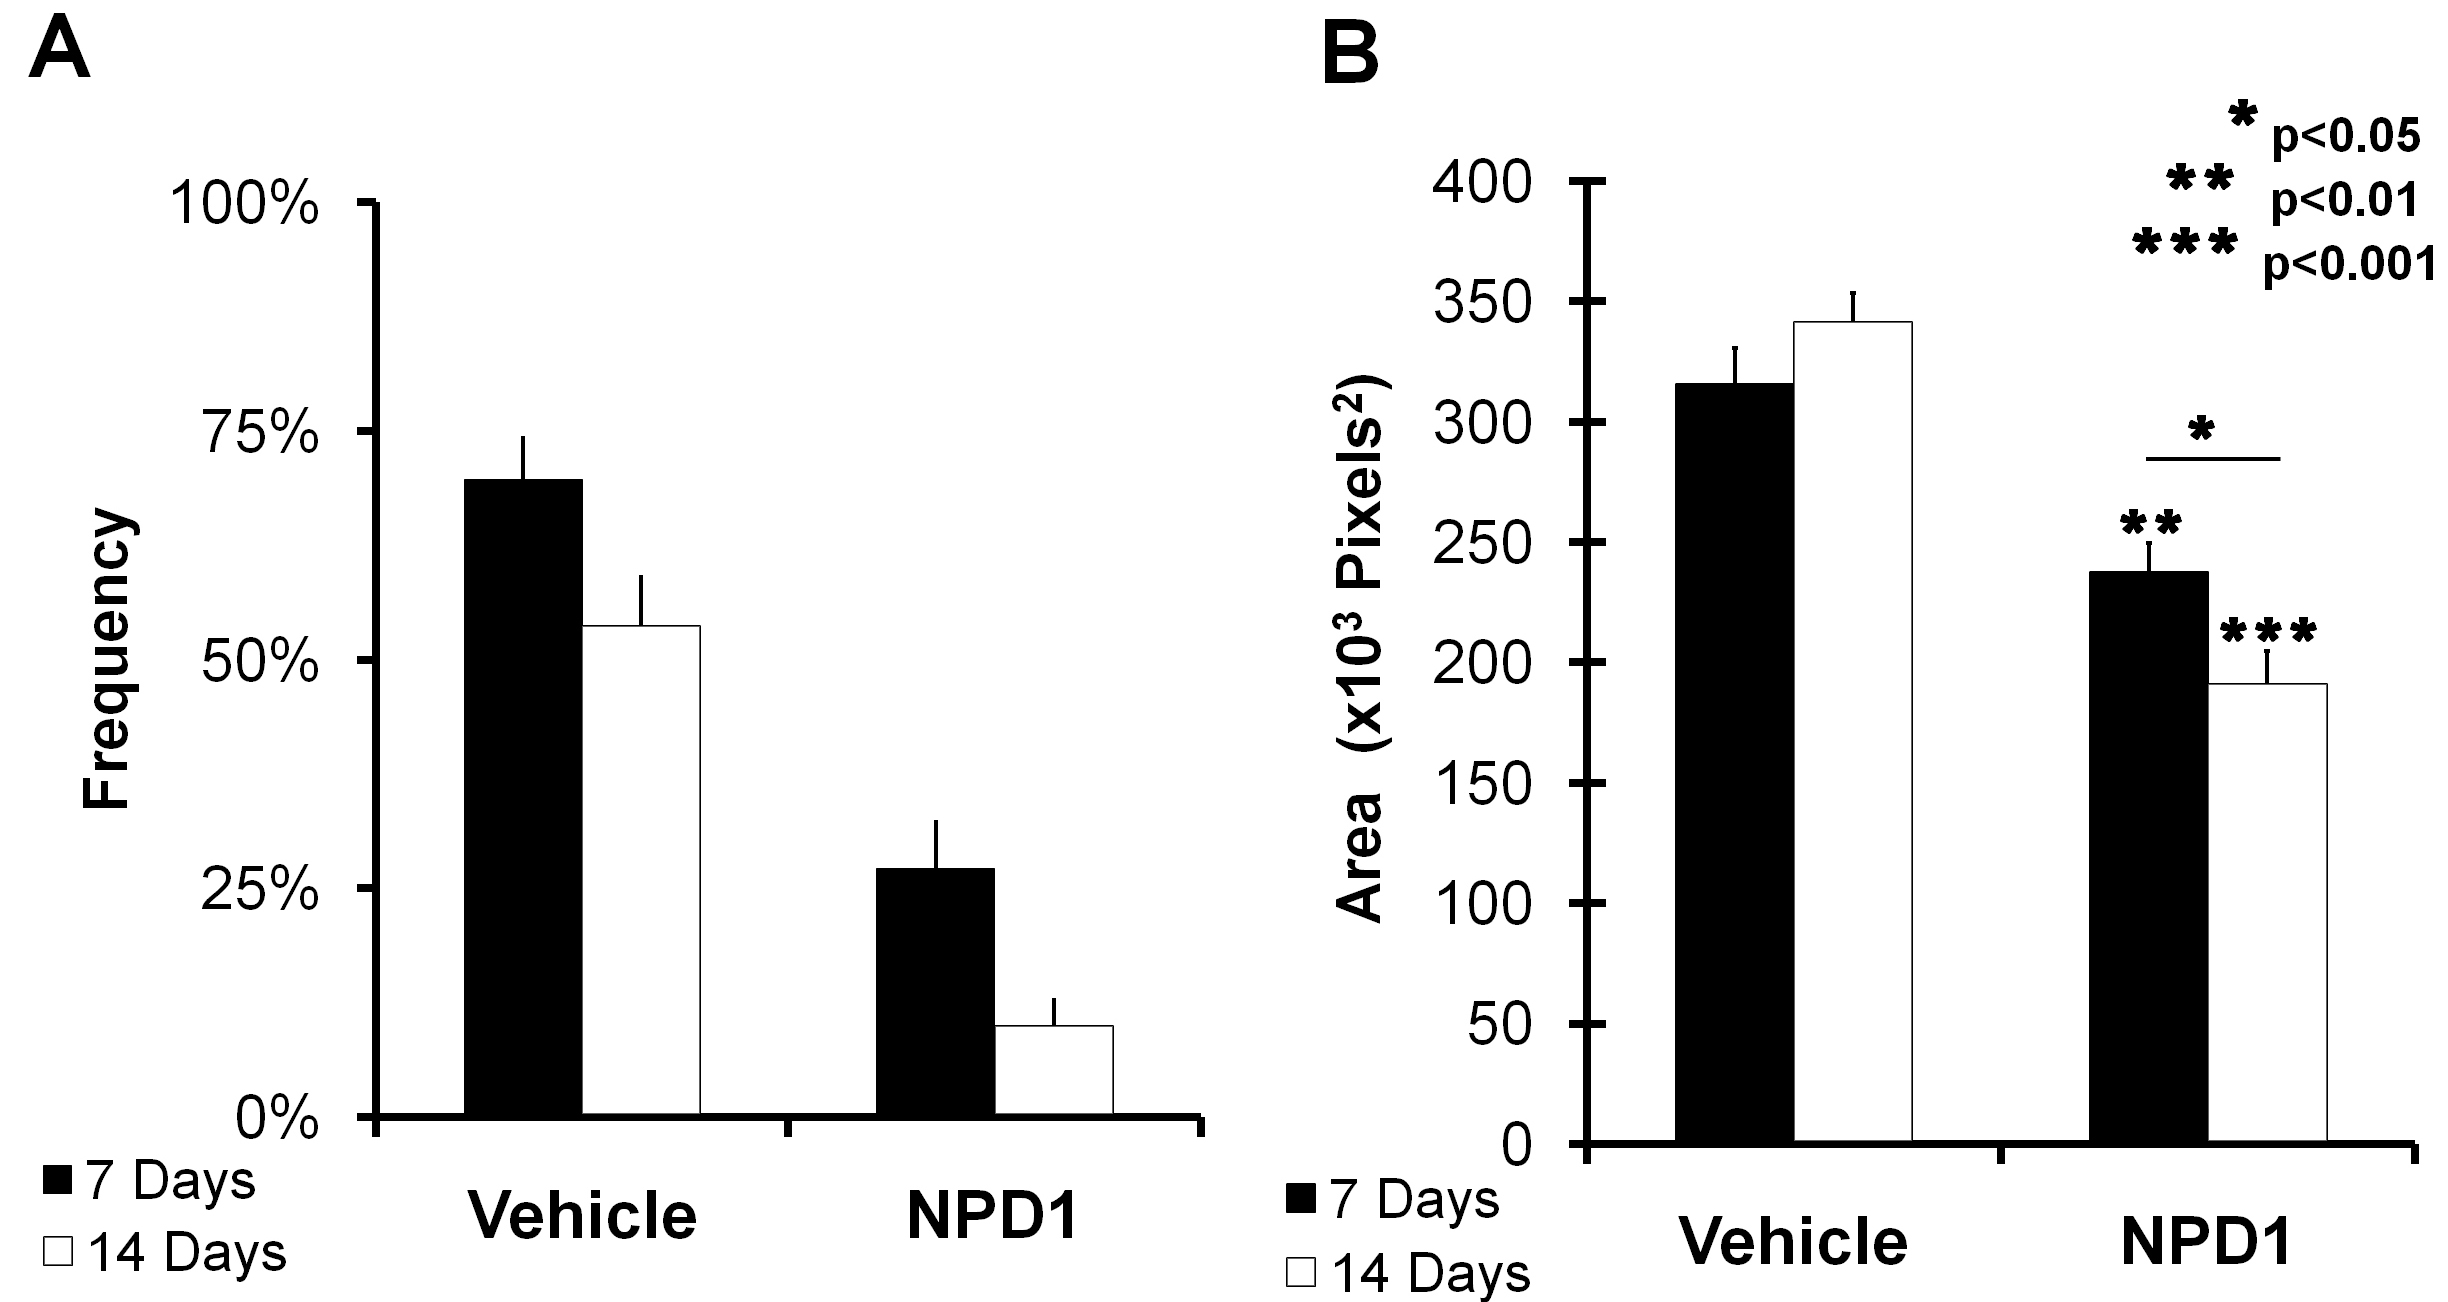
Figure 3. Angiographic analysis of
choroidal neovascularization (CNV)-associated leakage clouds.
A:
The
graph represents the frequency of occurrence of clinically relevant
lesions. The percent occurrence of only lesions considered clinically
analogous to human lesions are shown. This comparison of lesions from
control and neuroprotecin D1 (NPD1)-treated animals at 7 and 14 days
post-laser treatment (from
Figure 2) shows an approximate
reduction in occurrence of >40% when NPD1 retinas are compared to
controls.
B: The graph represents the leakage cloud areas from
all laser lesions. Following administration of fluorescein
(intraperitoneal), the resulting cloud formed at each lesion site was
imaged at 1 and 5 min. Early and late images of each lesion were
presented serially in a randomized and blind fashion to an observer who
manually outlined the leakage area. The graph represents adjusted means
produced using a general linear model. Leakage growth was significantly
lower in NPD1-treated animals than in controls at both 7 and 14 days.
Asterisks denote level of statistical significance as compared to
vehicle (*p<0.05; **p<0.01; *** p<0.001).
 Figure 3 of Sheets, Mol Vis 2010; 16:320-329.