Figure 3. Combined gene therapy groups had significantly fewer inflammatory cell infiltrates. A: Histology of chemically burned corneas stained with hematoxylin and eosin (200×). B: Three fields of each slide close to the axis running from the center of new capillaries to the center of the cornea were
selected, and the total number of inflammatory cells was counted under a microscope in a blind fashion. The total cell counts
in each slide were averaged and an analysis of variance (ANOVA) was carried out. Three sections of each group were observed
and shown as mean±SD. The asterisk indicates p<0.05, and the double asterisk indicates p<0.01, compared with the vehicle vector
group.
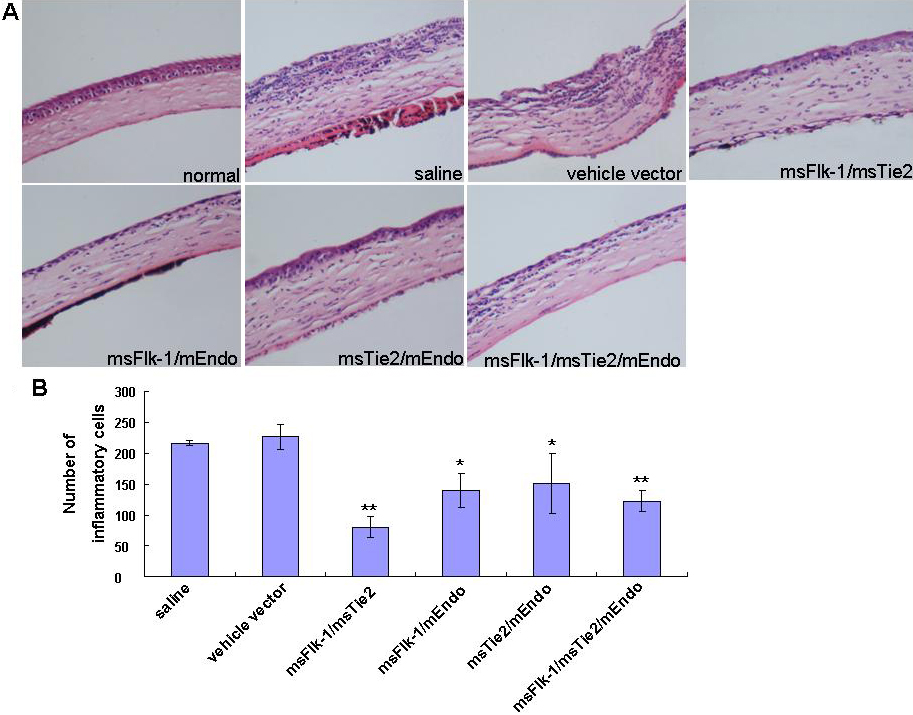
 Figure 3 of
Chen, Mol Vis 2010; 16:310-319.
Figure 3 of
Chen, Mol Vis 2010; 16:310-319.