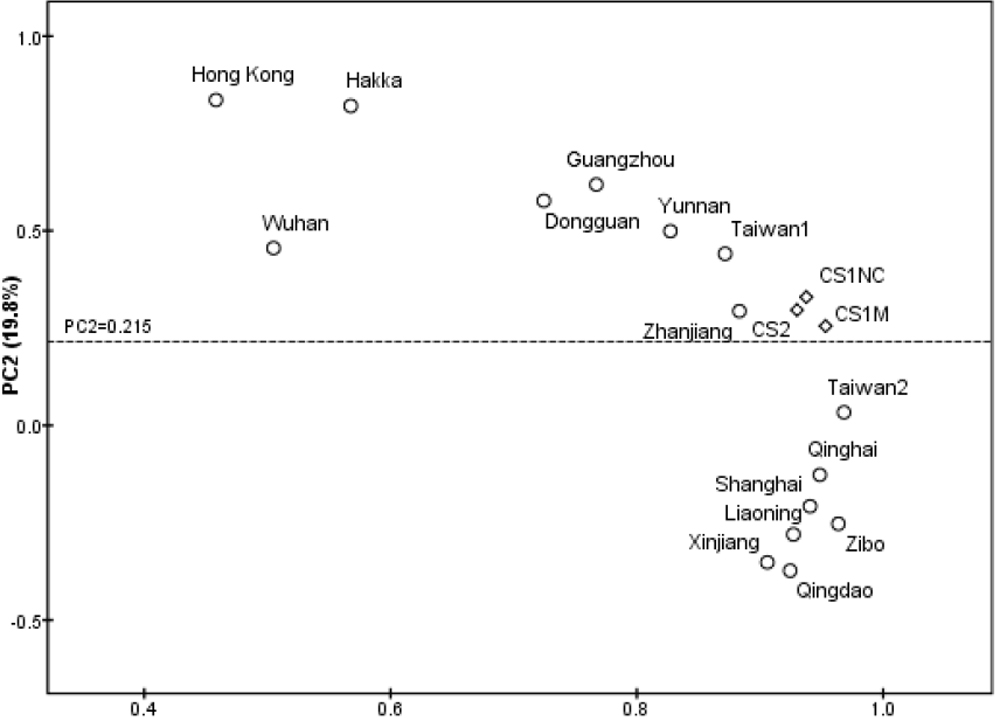
Figure 1. Principal component map of
mitochondrial DNA variation. The mitochondrial DNA data (with respect
to the haplogroup frequencies in
Table 2) of 16 reported regional
Han populations were from references ([
26,
28]
and references therein).
The
three Chaoshanese populations are marked by diamonds, whereas other
Han Chinese populations are labeled by circles with city or province
names above the circle. CS1M and CS1NC represent the Chaoshanese
populations with (CS1M) and without (CS1NC) myopia in this study. CS2
indicates that the Chaoshanese mtDNA data were taken from a recent
report [
26].
This
figure
demonstrated that the Chaoshanese population in this study is
identical to the Chaoshanese population previously reported but is
different from other Chinese population based on mitochondrial DNA
haplogroup analysis.
 Figure 1 of Wang, Mol Vis 2010; 16:303-309.