Figure 4. The percent distribution of phosphorylated sites identified by gel-free IMAC enriched phosphopeptide and LC-MS/MS analysis.
A: Proportion of the proteins with phosphorylation in total lens extract. B: Distribution of in vivo phosphorylation sites in αB-crystallin. C: Distribution of in vivo phosphorylation sites in βB1-crystallin. D: Distribution of in vivo phosphorylation sites in αA-crystallin. The three most abundantly phosphorylated proteins (%) in
the lens are shown under the identified phosphoproteins in A-D. It is noted that phosphorylated sites of αA-crystallin are more evenly distributed along the protein molecule than αB- and
βB1-crystallins which show the predominant phosphorylation sites at residues 59 and 189 in αB- and βB1-crystallins, respectively.
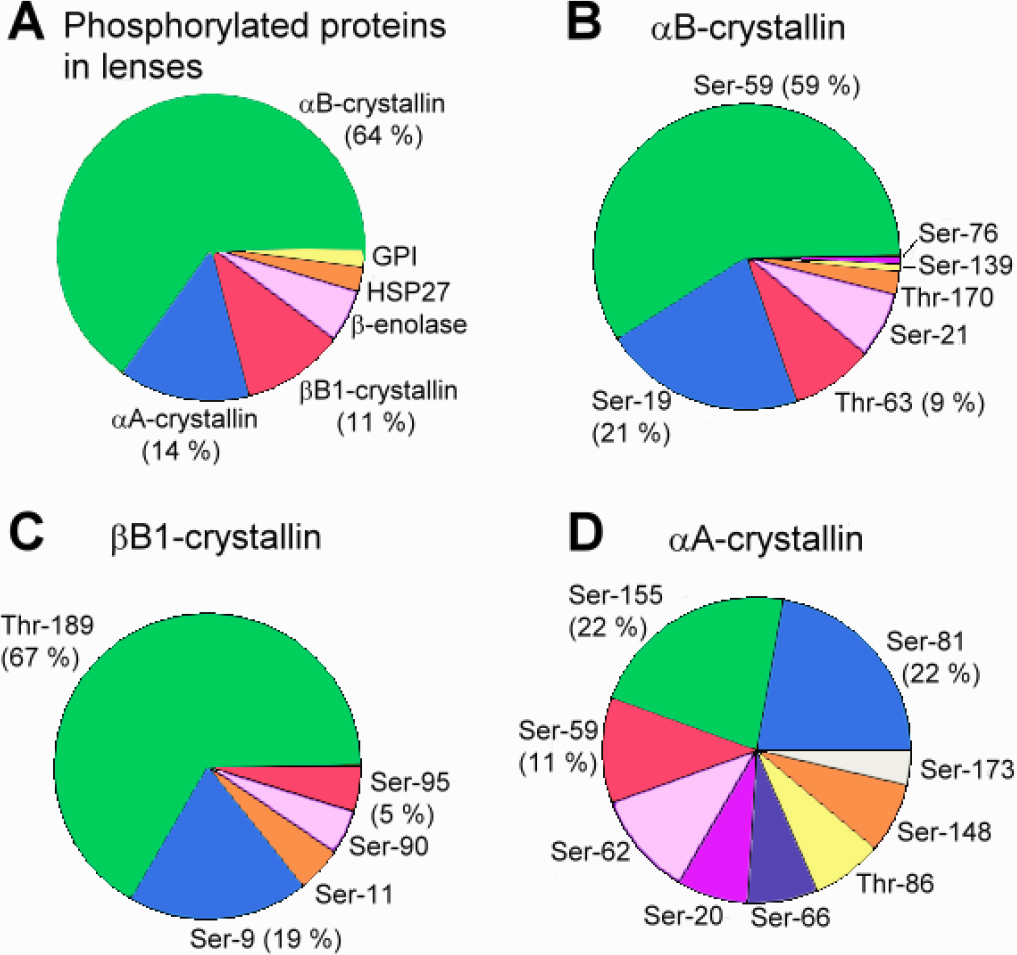
 Figure 4 of
Chiou, Mol Vis 2010; 16:294-302.
Figure 4 of
Chiou, Mol Vis 2010; 16:294-302.