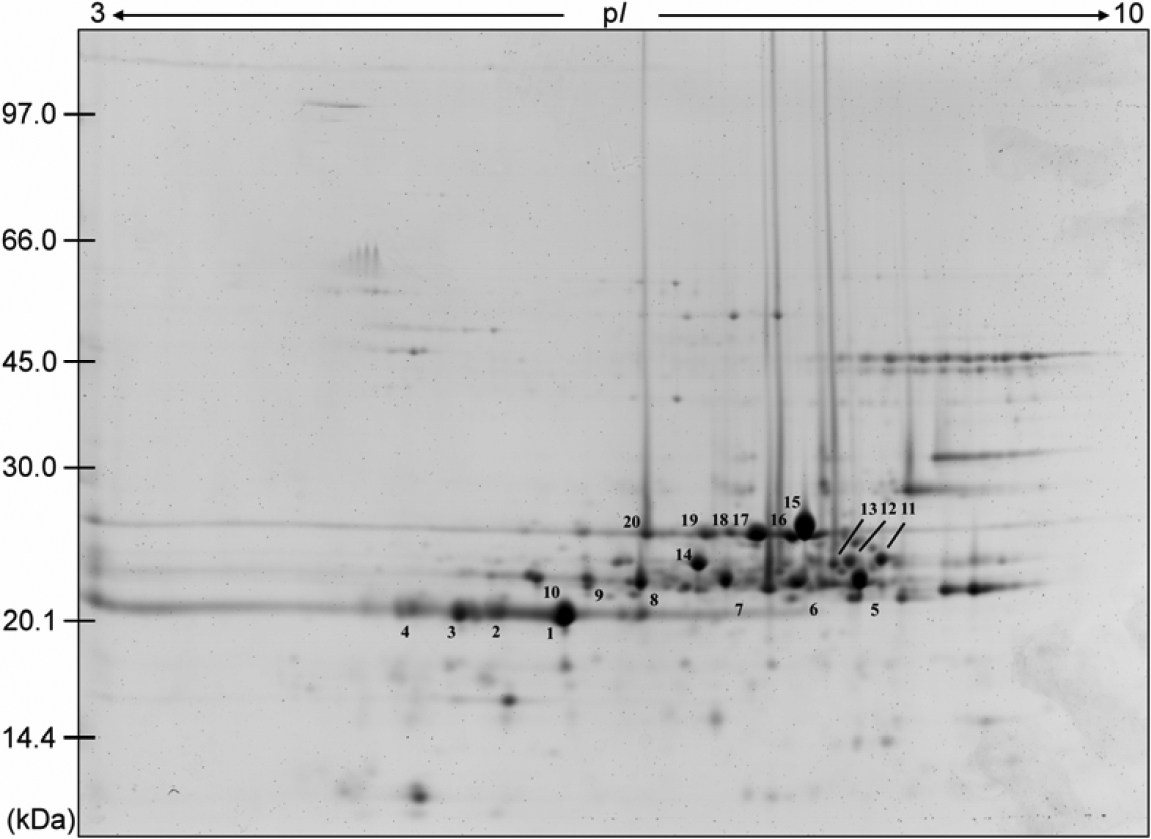
Figure 1. 2-DE gel patterns of porcine lens proteins. Total protein (100 μg) in each sample was loaded onto immobilized pH gradient
(IPG) gel strips (pH 3–10 Nonlinear, 13 cm). For the first-dimensional separation, IEF was performed using Ettan IPGphor II
(Amersham Biosciences) at 300–8,000 V for 16 h. After IEF, the IPG strips were equilibrated in SDS-urea buffer and placed
onto the second-dimensional SDS–PAGE. After electrophoresis, the gels were fixed in 10% methanol and 7% acetic acid and stained
by Sypro-Ruby. The IPG strips were rehydrated, and after IEF, subjected to 2-DE. Protein spots marked by No. 1–20 on the map
were further identified by nano LC-MS/MS and listed in
Table 1. It is noteworthy that porcine lenses contain many protein isoforms which present themselves as a series of parallel spots
with similar molecular masses in 2-DE profiles. The result is representative of three independent experiments.
 Figure 1 of
Chiou, Mol Vis 2010; 16:294-302.
Figure 1 of
Chiou, Mol Vis 2010; 16:294-302.