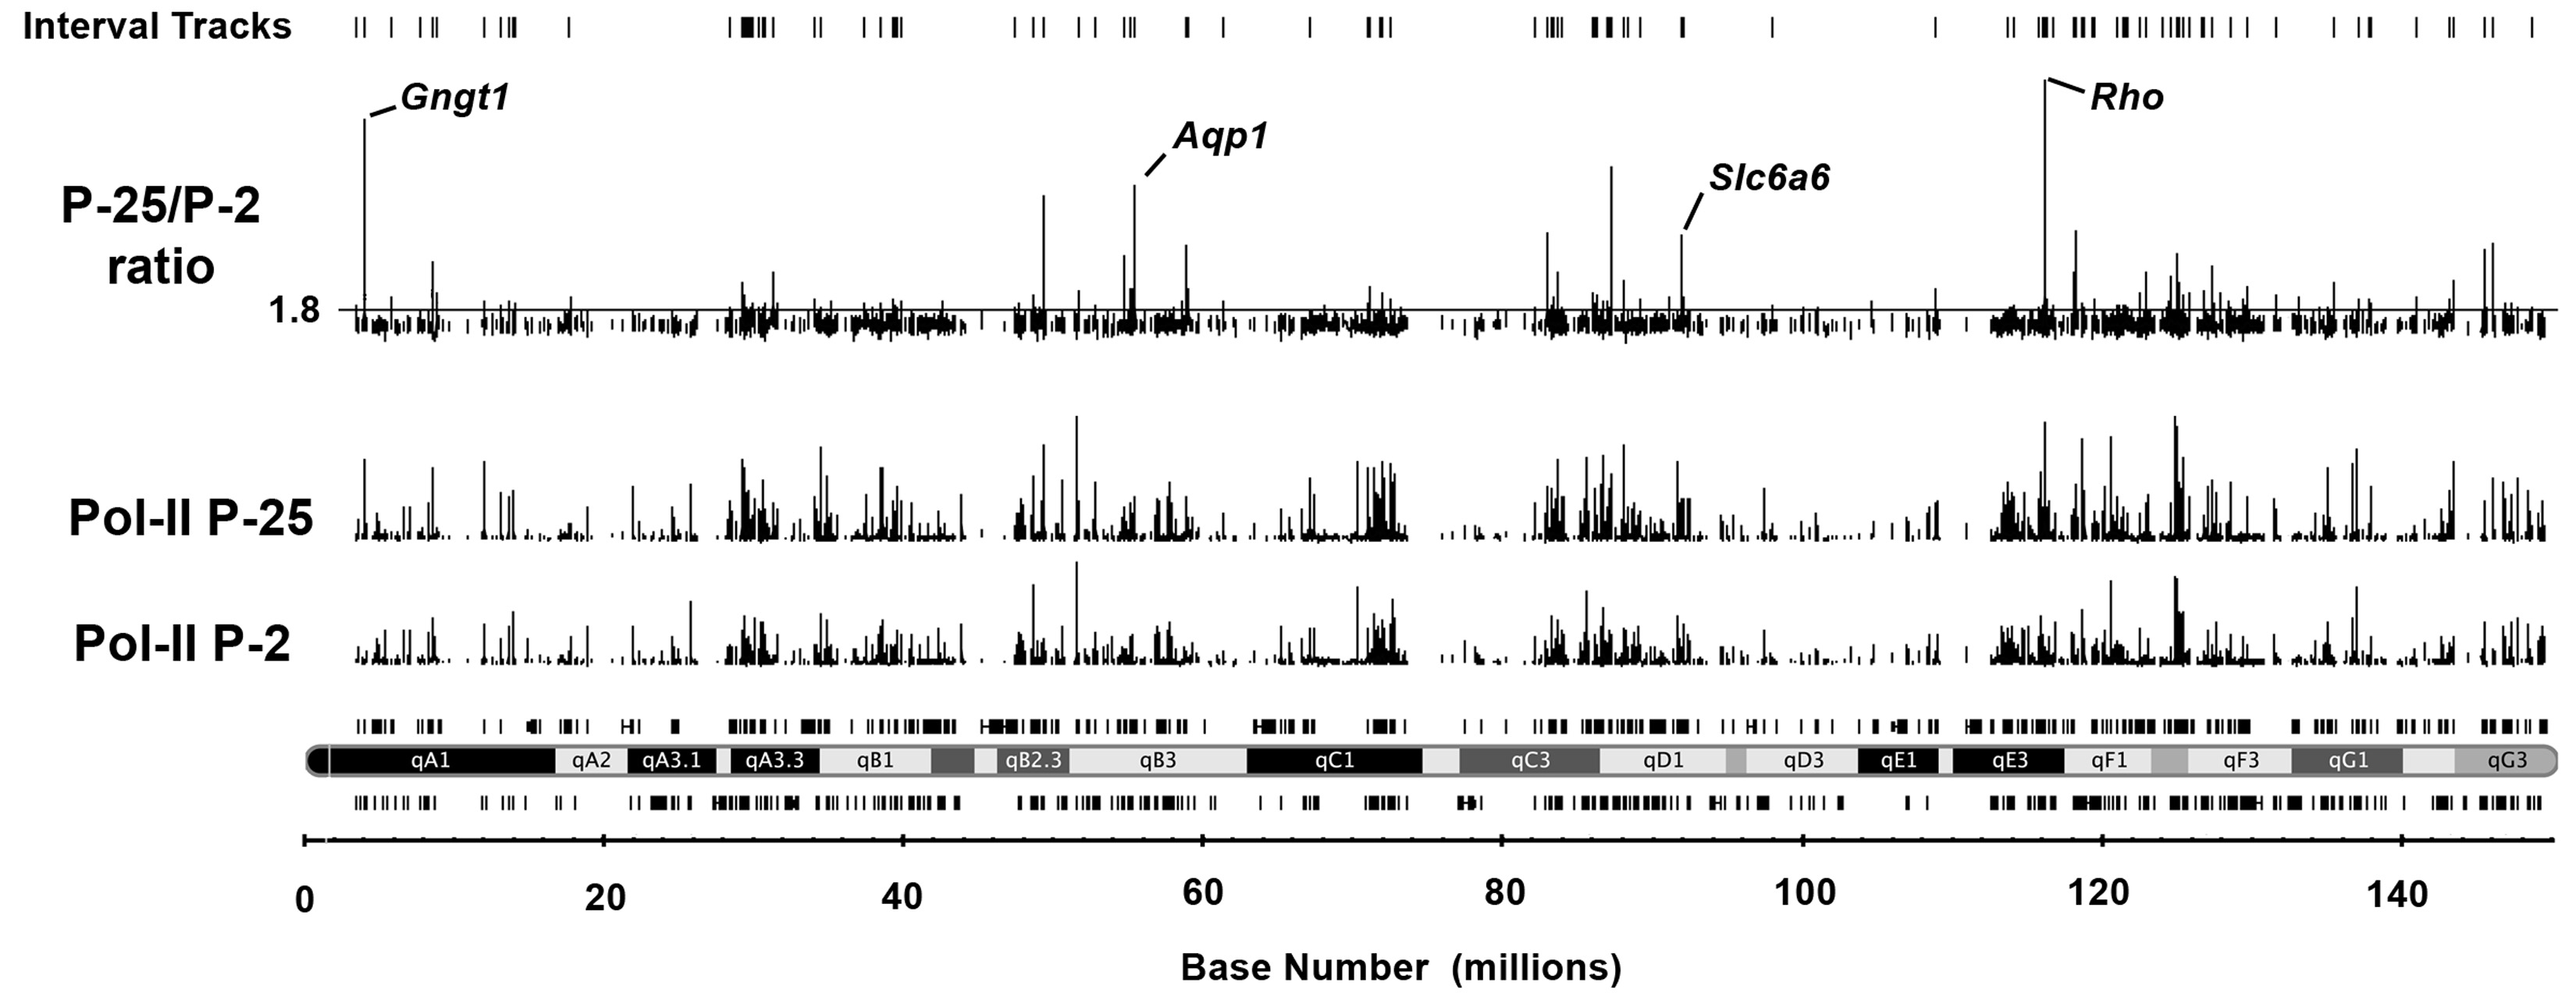
Figure 4. ChIP-on-chip map of changes in
RNA-Polymerase-II (Pol-II) association around transcription start sites
on chromosome 6 in P2 and P25 mouse neural retina. ChIP was performed
using an antibody specific for RNA polymerase-II. ChIP DNA was
amplified, labeled, and hybridized onto Affymetrix gene chip mouse
promoter tiling arrays (v.1), as detailed in the methods. Probe
intensity data were normalized to total genomic DNA (non-ChIP) and the
linear scaling format option. Chromosome 6 data are shown here for age
P2 (Pol-II P2) and age P25 (Pol-II P25), including a plot of the Pol-II
signal ratio (P25/P2 ratio). The horizontal line indicates the Pol-II
peak signal ratio (1.8) selected to predict an increased activation
state during terminal maturation of photoreceptors. This value was
validated through follow-up analysis of the test gene set representing
a full range of Pol-II peak signal ratios (
Table 1). The locations of many
genes displaying activation increases are readily visible. Some
examples include Rhodopsin
(Rho), Transducin-γ subunit
(Gngt1),
Aquaporin
(Aqp1), and Na: neurotransporter symporter for
taurine and β-alanine
(Slc6a6).
 Figure 4 of Tummala, Mol Vis 2010; 16:252-271.