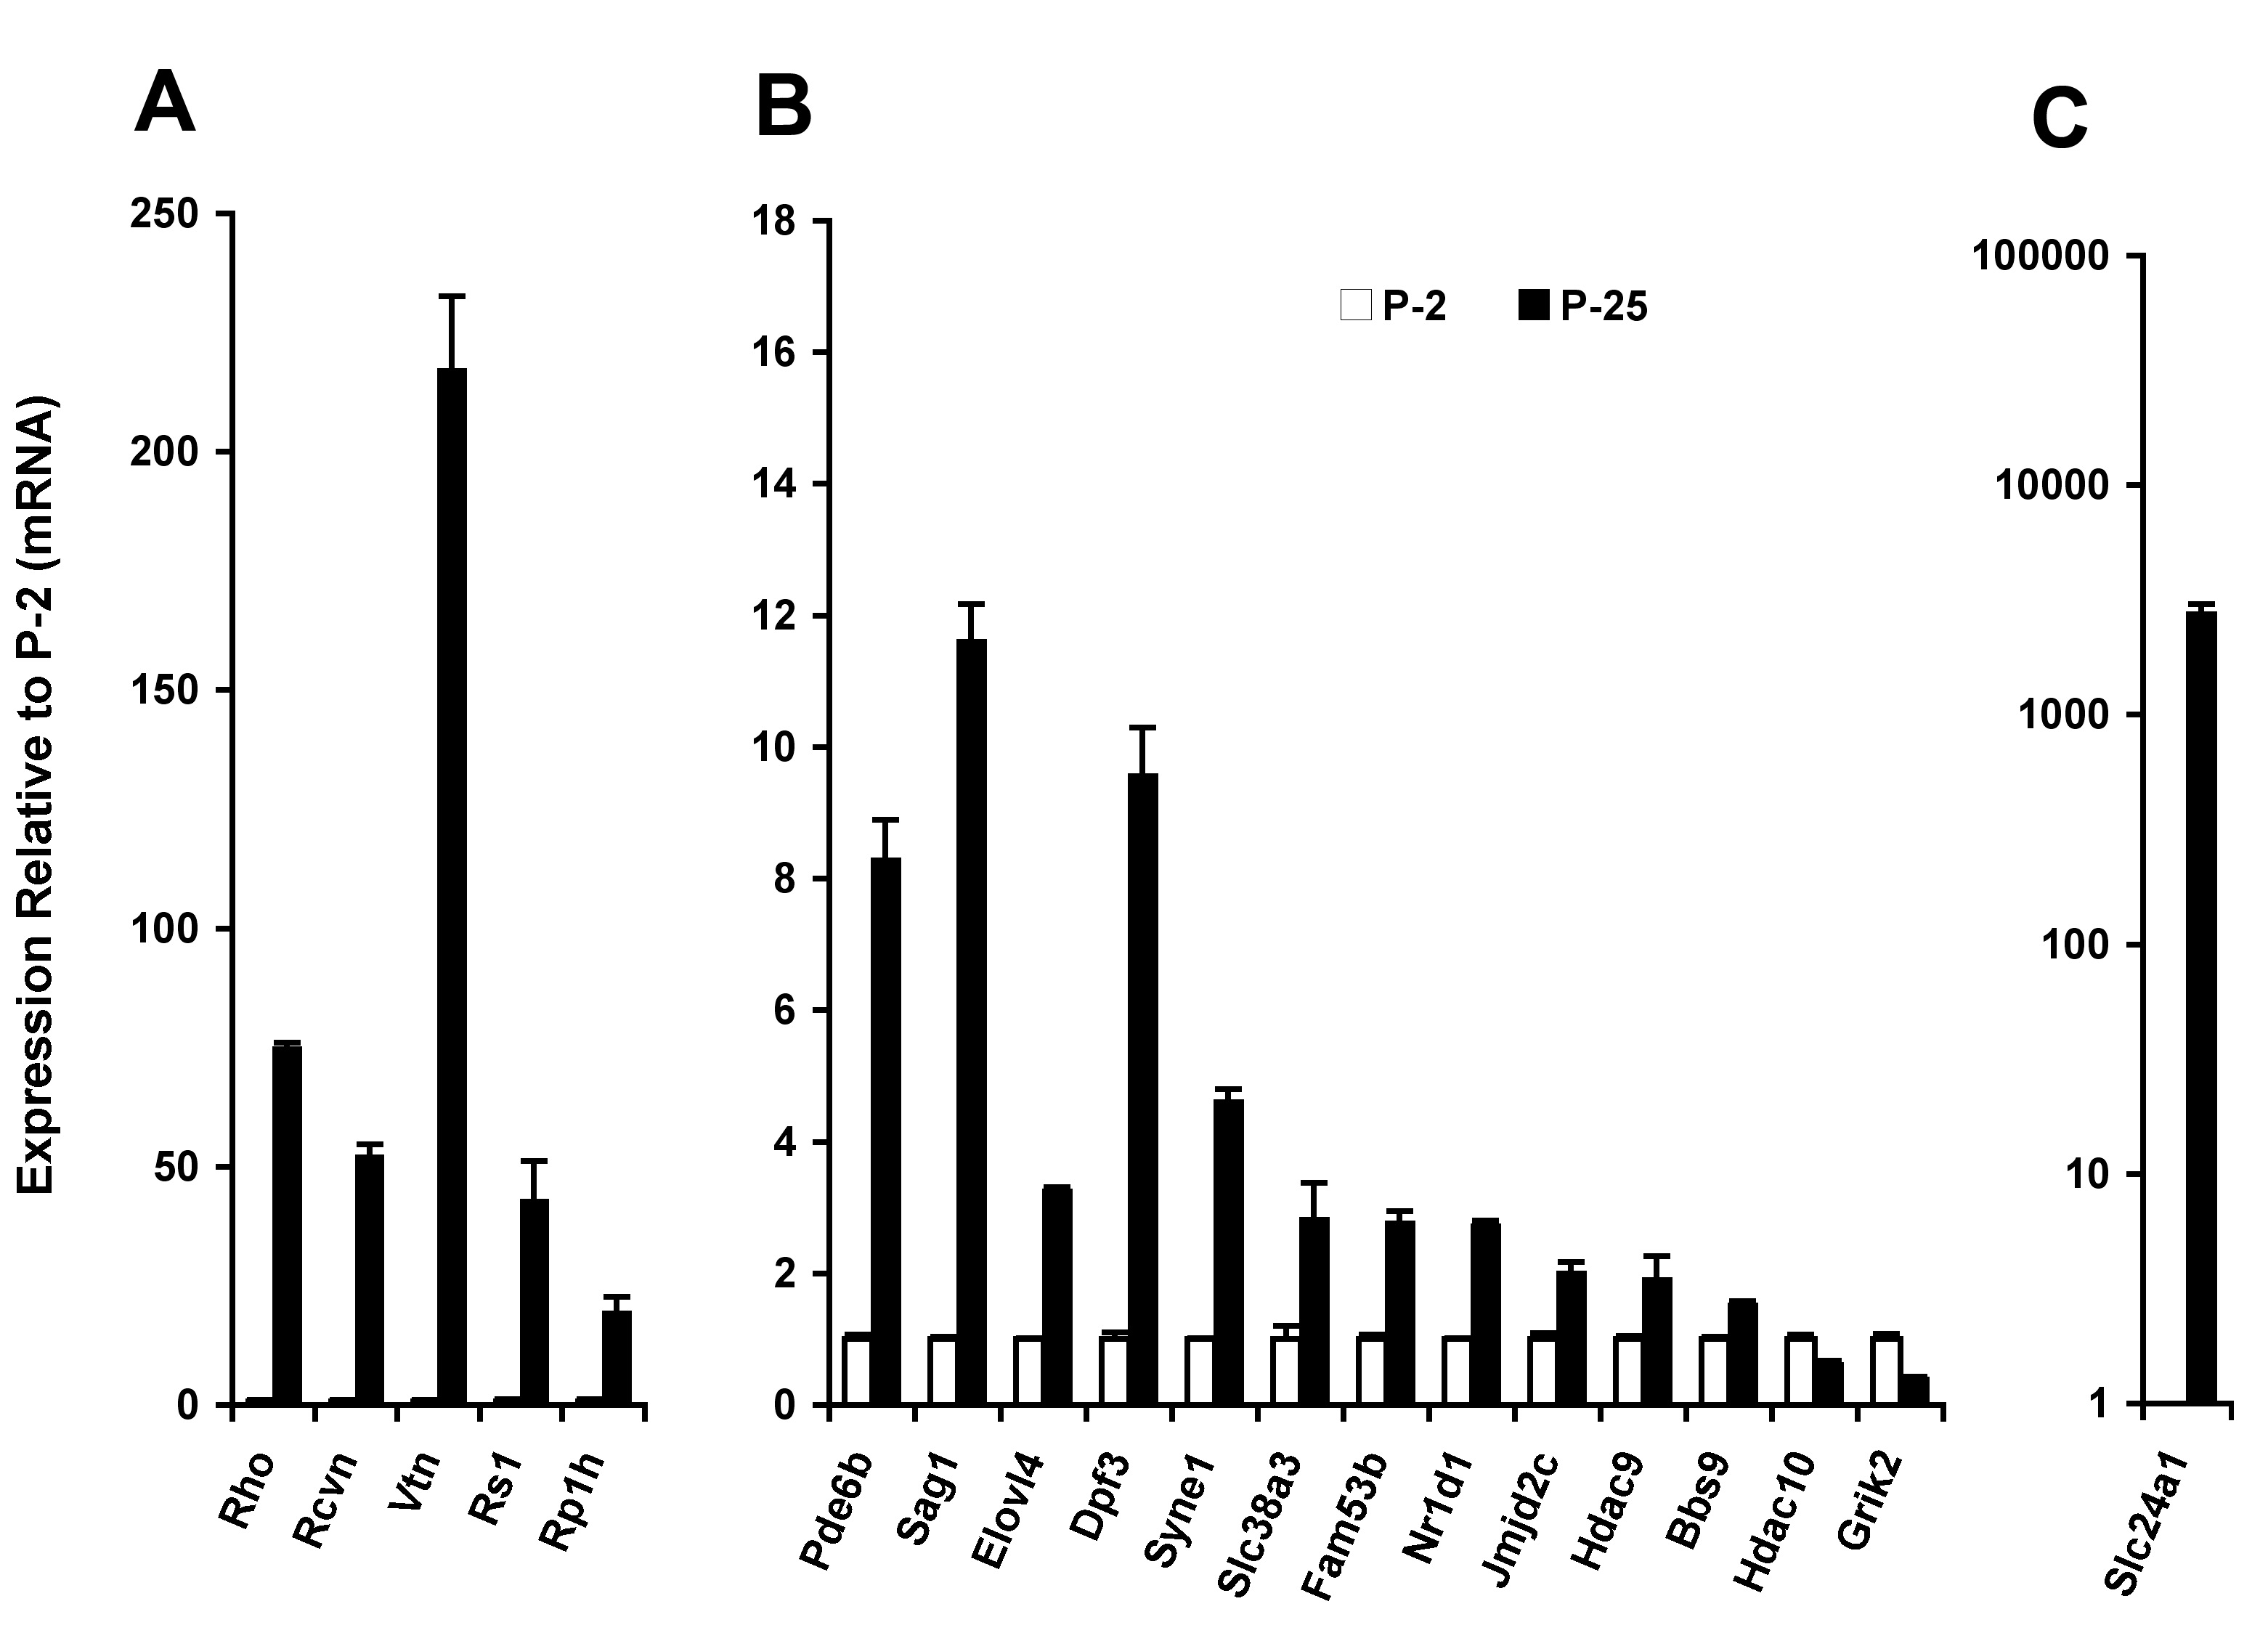
Figure 3. Expression changes (mRNA) of
evaluation genes.
A-C: Relative mRNA concentrations in the
mouse neural retina were measured by qPCR (real time) for the
developmental ages P2 and P25. Concentrations were normalized to the
beta-Actin mRNA concentration. Bars indicate standard deviation for
triplicate assays. Taqman chemistry was used for target specificity
with hydrolysis probes that span exon junctions.
Rho,
Rcvn,
Pde6b, and
Sag1 are key markers of
photoreceptor-specific gene expression. Genes are grouped to account
for different scales of relative expression. Most genes had Pol-II peak
signal ratios > 1.8, as determined from temporal Pol-II ChIP-on-Chip
analysis, except for:
Hdac9 (ratio 1.6),
Hdac10 (ratio
1.7), and
Grik2 (ratio 0.9,
Table 1). Genes: Rhodopsin
(Rho),
Recoverin
(Rcvrn), Retinoschisis 1
(Rs1),
Phosphodiesterase 6b
(Pde6b), S-antigen
(Sag),
Elongation of very long chain fatty acids-like 4
(Elovl4), D4,
zinc and double PHD fingers, family 3
(Dpf3), Spectrin repeat
containing, nuclear envelope 1
(Syne1), Solute carrier family
38, Na/H -coupled glutamine transporter, member 3
(Slc38a3),
Family with sequence similarity 53, member B
(A930008G19Rik,
Fam53b), Nuclear receptor subfamily 1, group D, member 1
(Nr1d1),
Jumonji domain containing 2C
(Jmjd2c), Histone deacetylase 9
(Hdac9),
Bardet-Biedl syndrome 9
(E130103I17Rik, Bbs9), Histone
deacetylase 10
(Hdac10), Glutamate receptor, ionotropic,
kainate 2
(beta 2) (Grik2), Solute carrier family 24, Na/K/Ca
exchanger, member 1
(Slc24a1).
 Figure 3 of Tummala, Mol Vis 2010; 16:252-271.