Figure 1. Determination of Pol-II
active-region/gene associations and changes to gene activation state
for specific genes. RNA-Polymerase-II (Pol-II) ChIP-on-chip data could
be examined on any continuous scale from entire chromosomes to single
genes. Determination of Pol-II active regions, the association of
active regions to genes, and the calculation of specific metrics for
each region, required the sequential use of TAS and the TransPath
program. A: First, TAS generated interval tracks where Pol-II
signal levels were above an intermediate threshold. This is illustrated
for a region surrounding Pde6B, a key marker of photoreceptor
terminal maturation. Second, interval track data were processed using
TransPath to determine active regions. Active regions were comprised of
one or more interval tracks in close proximity. Two active regions are
illustrated in the P25 neural retina. B: Higher resolution view
of the active region surrounding the Pde6b TSS. Signals for
individual tiling probes (35 bp spacing) are visible. For each active
region, TransPath calculated specific metrics, such as the Pol-II peak
signal ratio (P25/P2), as illustrated by the vertical black bars
indicating signal maxima from the P25 and P2 time point samples. Genes
in view: Phosophodiesterase 6b (Pde6b), Polycomb group
ring-finger 3 (Pcgf3), Complexin 1 (Cplx1).
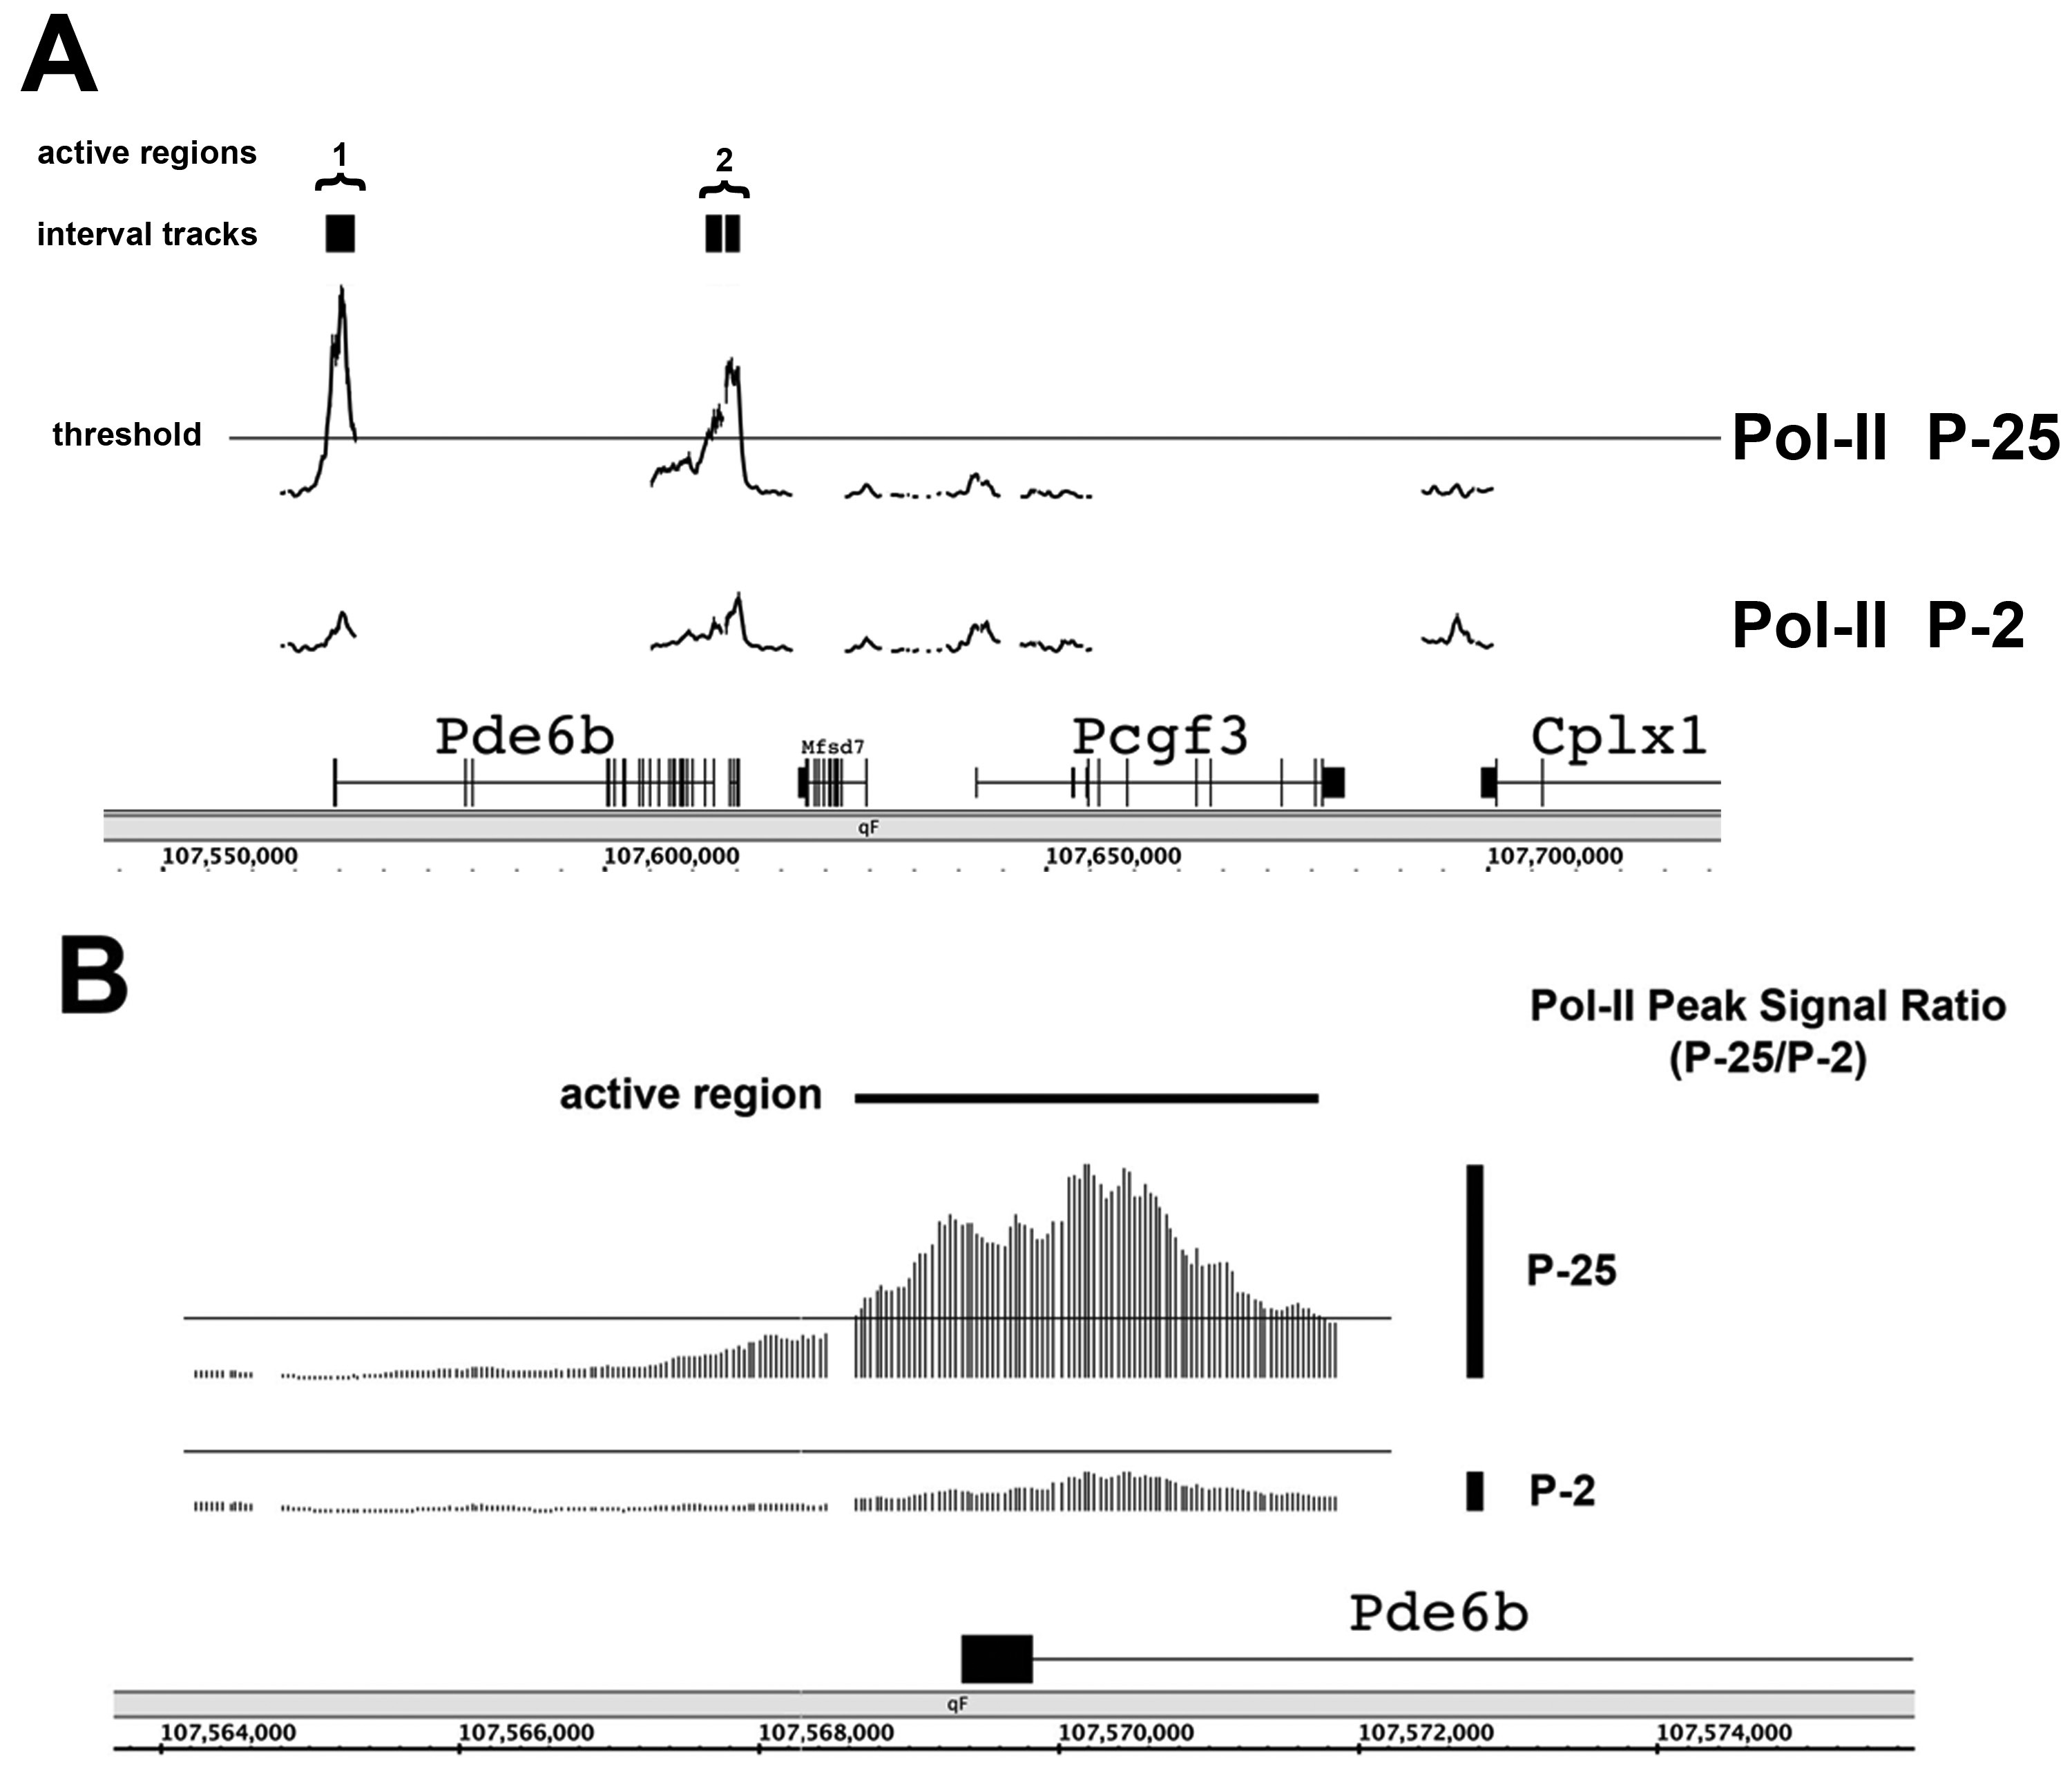
 Figure 1 of Tummala, Mol Vis 2010; 16:252-271.