Figure 2. Analysis of maximal pattern
electroretinogram (PERG) components in different mouse strains (n=6 for
each group). Data have been obtained from measurements of individual
waveforms in response to 1 Hz reversing gratings (spatial frequency
0.05 cycles/degree, contrast 1.0). A: Mean amplitude of the
positive peak with latency around 100 ms (P100) component. B:
Mean amplitude of the negative trough with latency around 250 ms (N250)
component. C: Mean latency of the P100 component. In all
panels, the error bars represent the standard error of the mean.
Brackets superimposed to adjacent bars represent statistical
comparisons (p value, t test) between means of C57BL/6J (B6)
and DBA/2J (D2) and between means of DBA/2J (D2) and DBA/2J.Gpnmb+.
The
level of statistical significance is also marked with one asterisk
(*) if p<0.05 and two (**) if p<0.01.
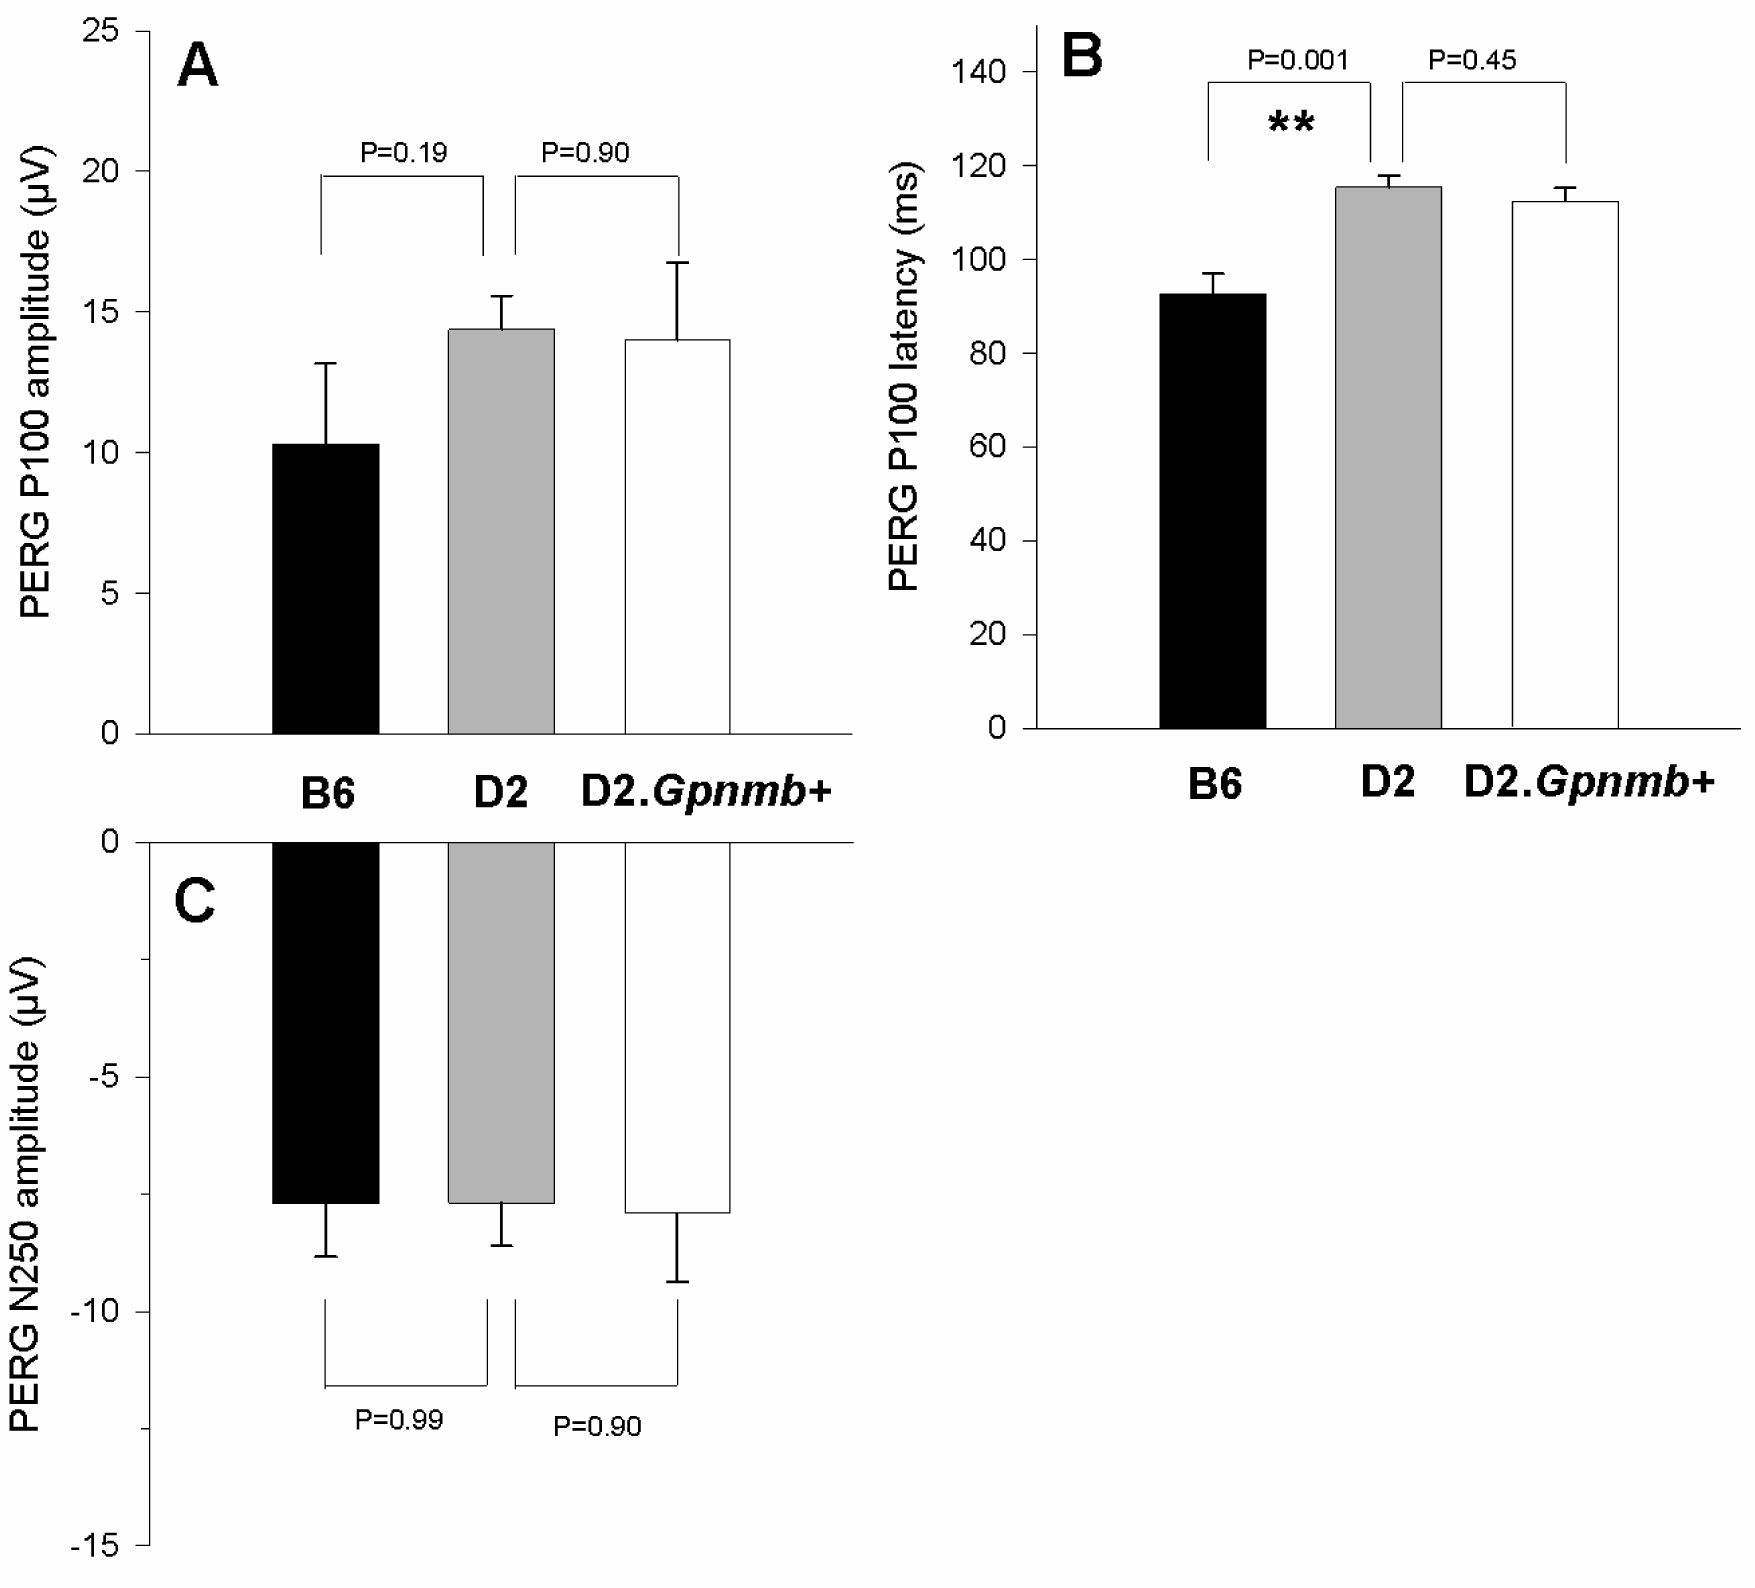
 Figure 2 of Porciatti, Mol Vis 2010; 16:2939-2947.