Figure 2. The ratios of anti-angiogenic cytokines (IFN-γ, IL-4, or IL-12p70) and angiogenic cytokines (MCP-1, IL-8) in tears of non-diabetic
controls, DNR, and DR. Data was expressed as mean±SEM. The asterisk indicatesd a p<0.05 DNR versus non-diabetic controls and
the dagger indicates a p<0.05 DR versus non-diabetic controls.
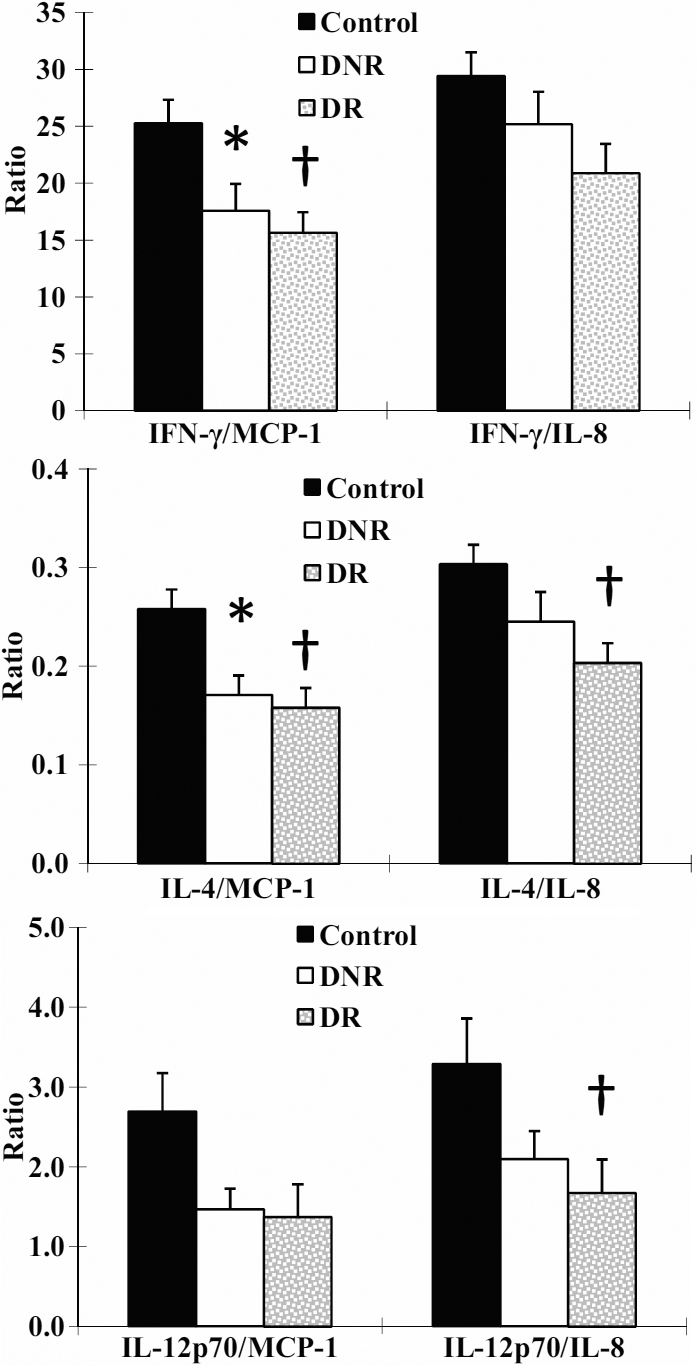
 Figure 2 of
Liu, Mol Vis 2010; 16:2931-2938.
Figure 2 of
Liu, Mol Vis 2010; 16:2931-2938.