Figure 1. Scatter plots of ages and serum hs-CRP levels (mg/l). Panel A was derived from all subjects comprising three genotypes. Panels B-D, respectively show data from wild-types, heterozygotes, and homozygotes. The linear regression equations are shown as solid,
straight lines. Abbreviations: CRP represents C-reactive protein.
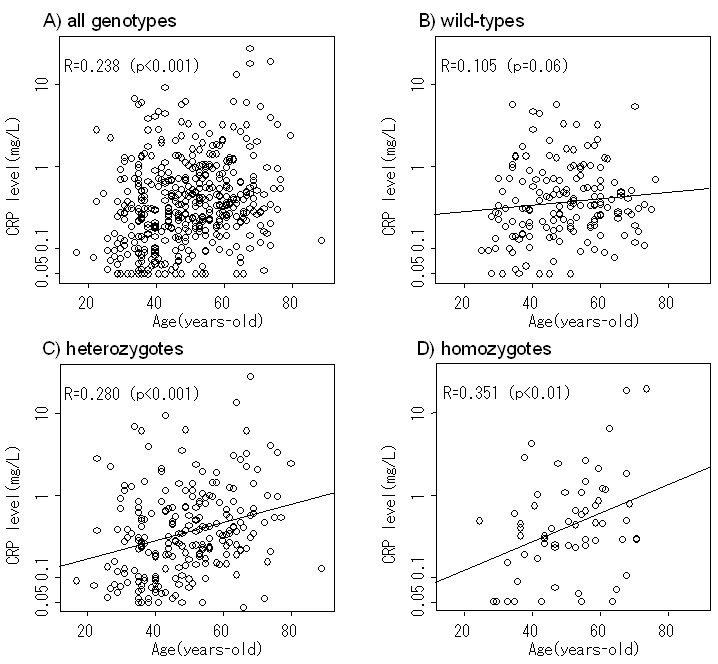
 Figure 1 of
Yasuma, Mol Vis 2010; 16:2923-2930.
Figure 1 of
Yasuma, Mol Vis 2010; 16:2923-2930.