Figure 2. Representative waveforms of flash visual evoked potential (F-VEP) in rats. A: Each peak of F-VEP could be distinguished clearly in normal rats, including N1, P1, and N2 waves. B: Immediately after the optic nerve injury, the F-VEP waveform appeared silent and peaks could not be identified. C: Four weeks after OEC+GDNF treatment, F-VEP latency obviously decreased and amplitude increased significantly in rats with
injured optic nerves.
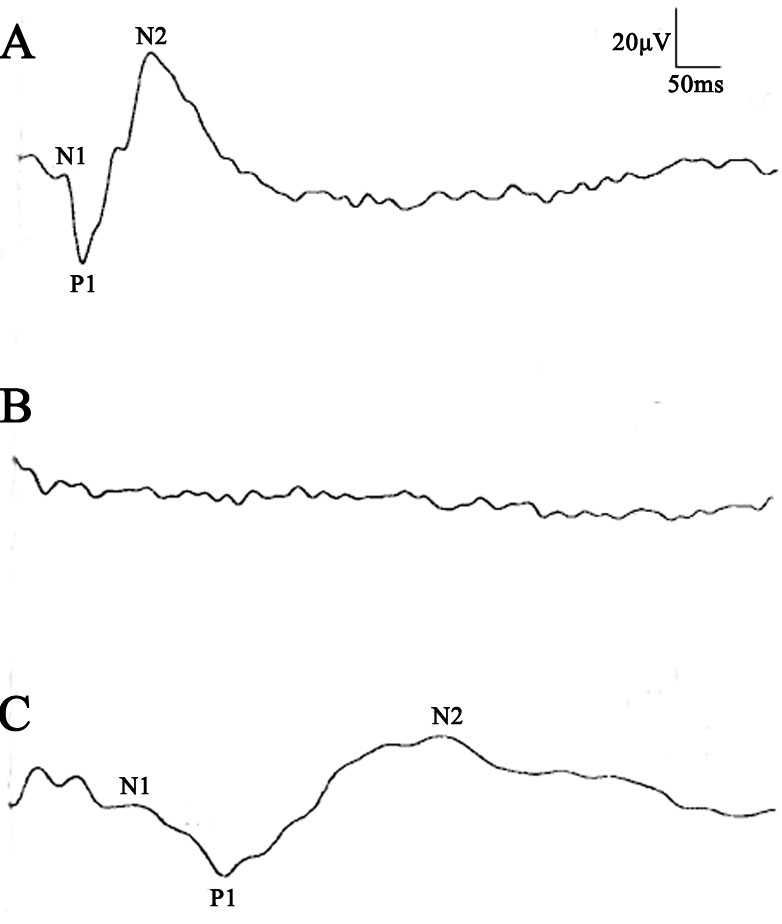
 Figure 2 of
Liu, Mol Vis 2010; 16:2903-2910.
Figure 2 of
Liu, Mol Vis 2010; 16:2903-2910.