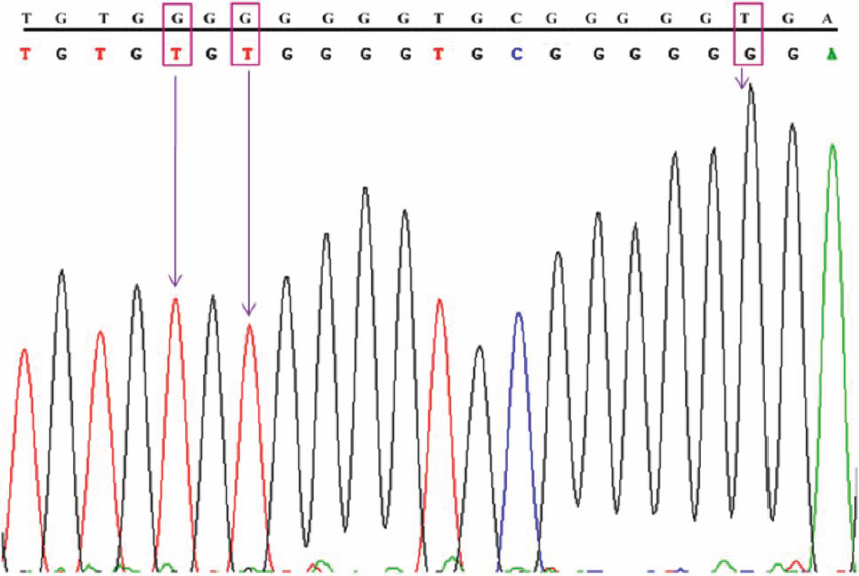
Figure 7. Chromatogram representing the g.1284G>T, g.1286G>T, and g.1299T>G polymorphisms from Intron-1 of MYOC. Top line: wild type sequence. Bottom line: observed sequence. The arrow indicates the position of sequence variation. Box
represents the variation.
 Figure 7 of
Pandaranayaka, Mol Vis 2010; 16:2891-2902.
Figure 7 of
Pandaranayaka, Mol Vis 2010; 16:2891-2902.