Figure 5. HinfI restriction digestion to screen the g.4453A>G polymorphism. 1 to 13 : Patient samples showing two distinct bands of
437 bp, 361 bp (absence of predicted g.4453A>G polymorphism). C: Control sample. M: 100bp DNA ladder. Arrow indicates the
product size.
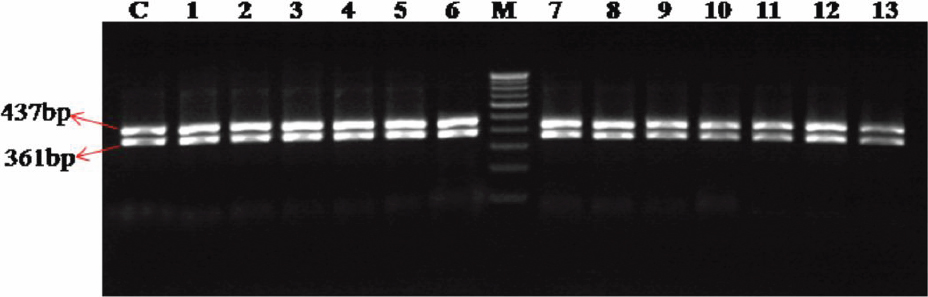
 Figure 5 of
Pandaranayaka, Mol Vis 2010; 16:2891-2902.
Figure 5 of
Pandaranayaka, Mol Vis 2010; 16:2891-2902.