Figure 4. Eco72I restriction digestion to reconfirm the predicted g.14072G>A polymorphism. 1,4,5,7,8: POAG samples showing three distinct
bands of 440bp, 233bp and 207 bp (reconfirms the heterozygous g.14072G>A polymorphism. 2,3,6,9,10,11,12: POAG samples showing
a distinct band 440 bp (reconfirms the homozygous g.14072G>A polymorphism). C1: Control sample showing heterozygous g.14072
G>A polymorphism. C2: Control sample showing homozygous g.14072 G>A polymorphism. M: 100 bp DNA ladder. Arrow indicates the
product size.
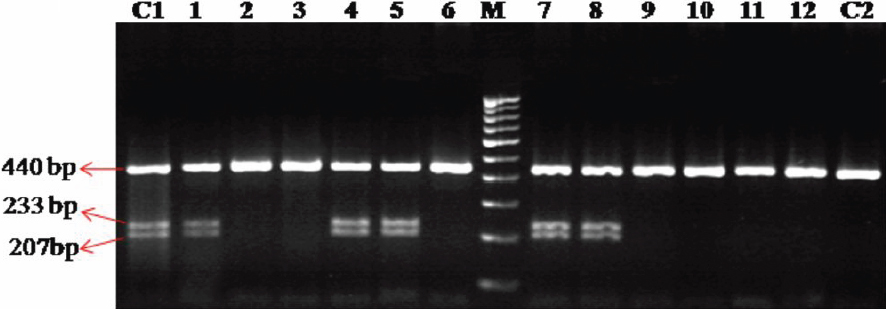
 Figure 4 of
Pandaranayaka, Mol Vis 2010; 16:2891-2902.
Figure 4 of
Pandaranayaka, Mol Vis 2010; 16:2891-2902.