Figure 3. Chromatogram of MYOC
showing predicted splice site variation (A) homozygous
g.14072G>A in patient-1 and (B) heterozygous g.14072G>A in
patient-2. Top line: wild type sequence. Bottom line: observed
sequence. The arrow indicates the position of sequence variation. Box
represents the variation.
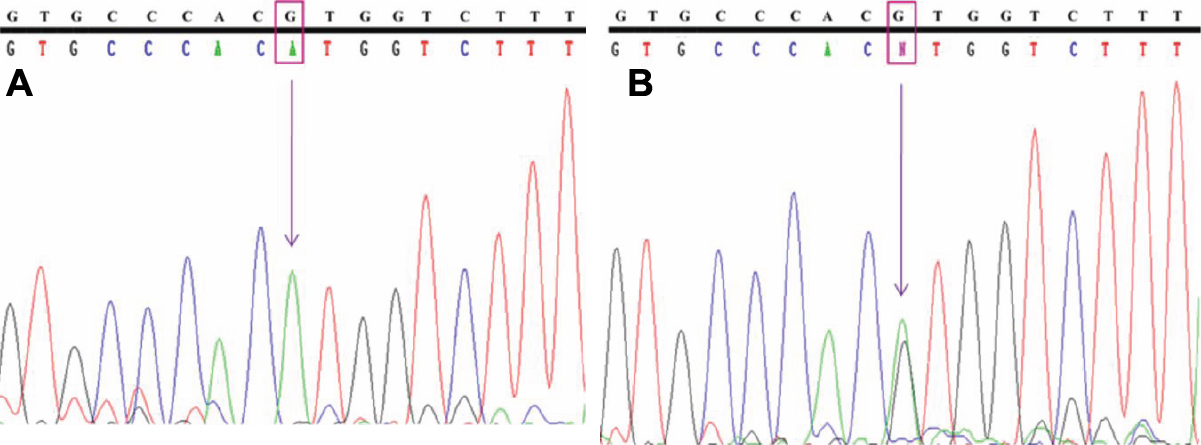
 Figure 3 of Pandaranayaka, Mol Vis 2010; 16:2891-2902.