Figure 1. Schematic diagram showing
schedule of lighting conditions and sampling points. Arrow in series 2
indicates times at which animals were switched to constant darkness
condition. Thin vertical bar joined by a horizontal bar indicates the
beginning and end of the sampling period. Series 1 is the control
condition, with animals maintained under light-dark conditions
(alternating white bars [12 h light=300 lux,] and black bars [12 h
dark]) throughout the experiment. Series 2 represents total darkness
(alternating black dots on a white background [subjective day] and
black bars).
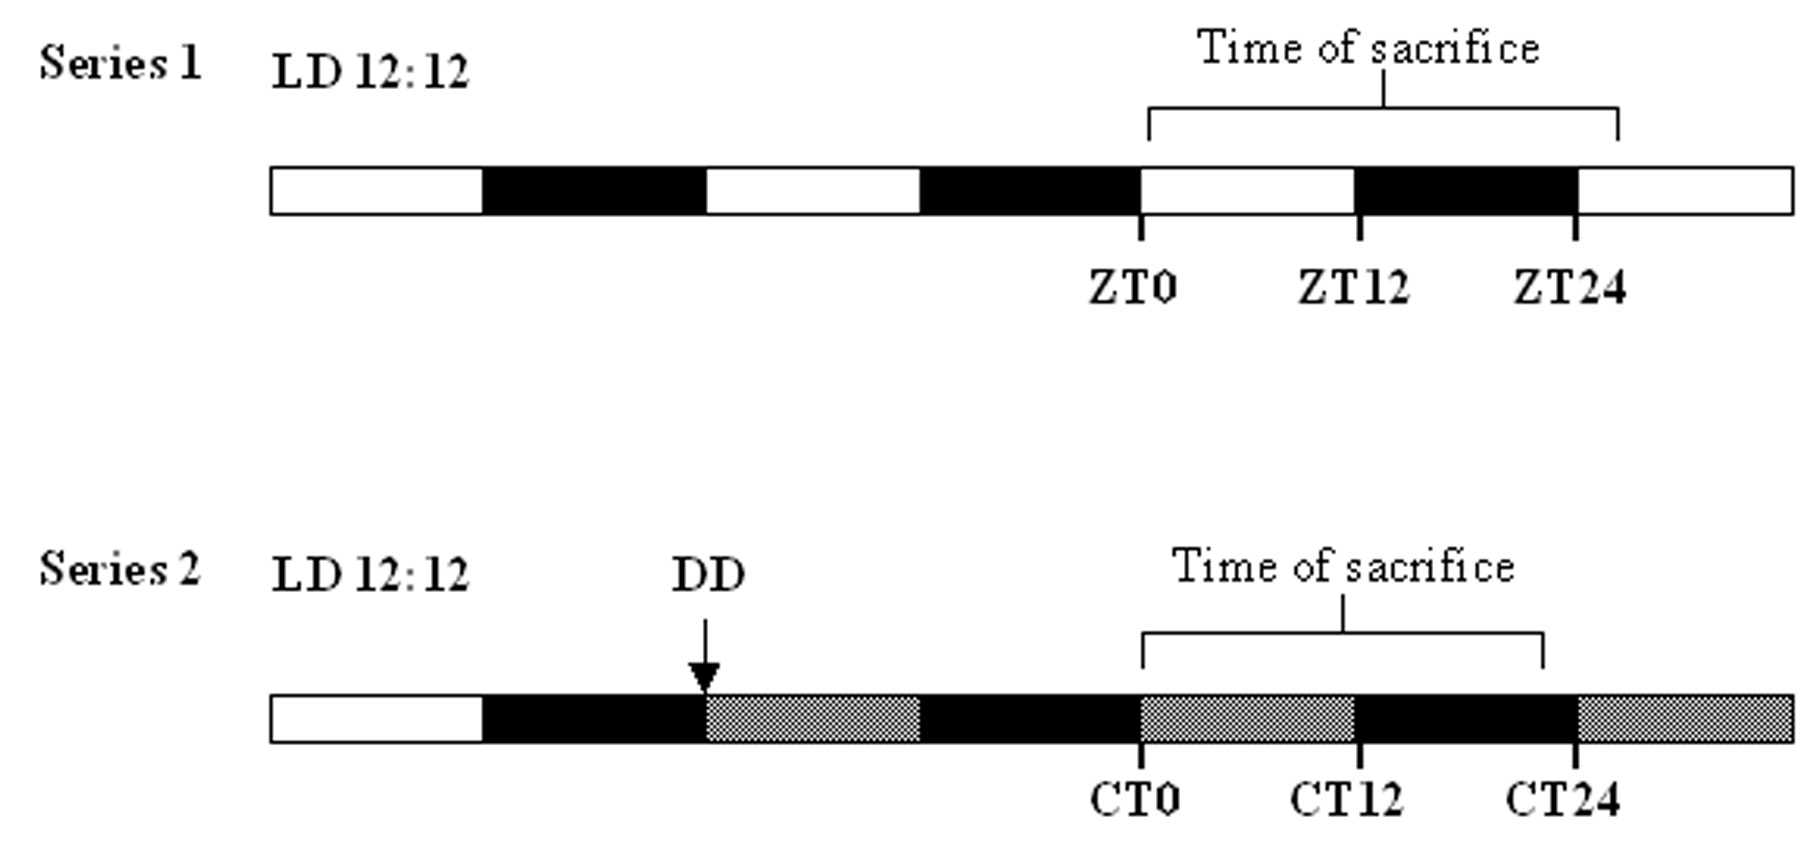
 Figure 1 of Krigel, Mol Vis 2010; 16:2873-2881.