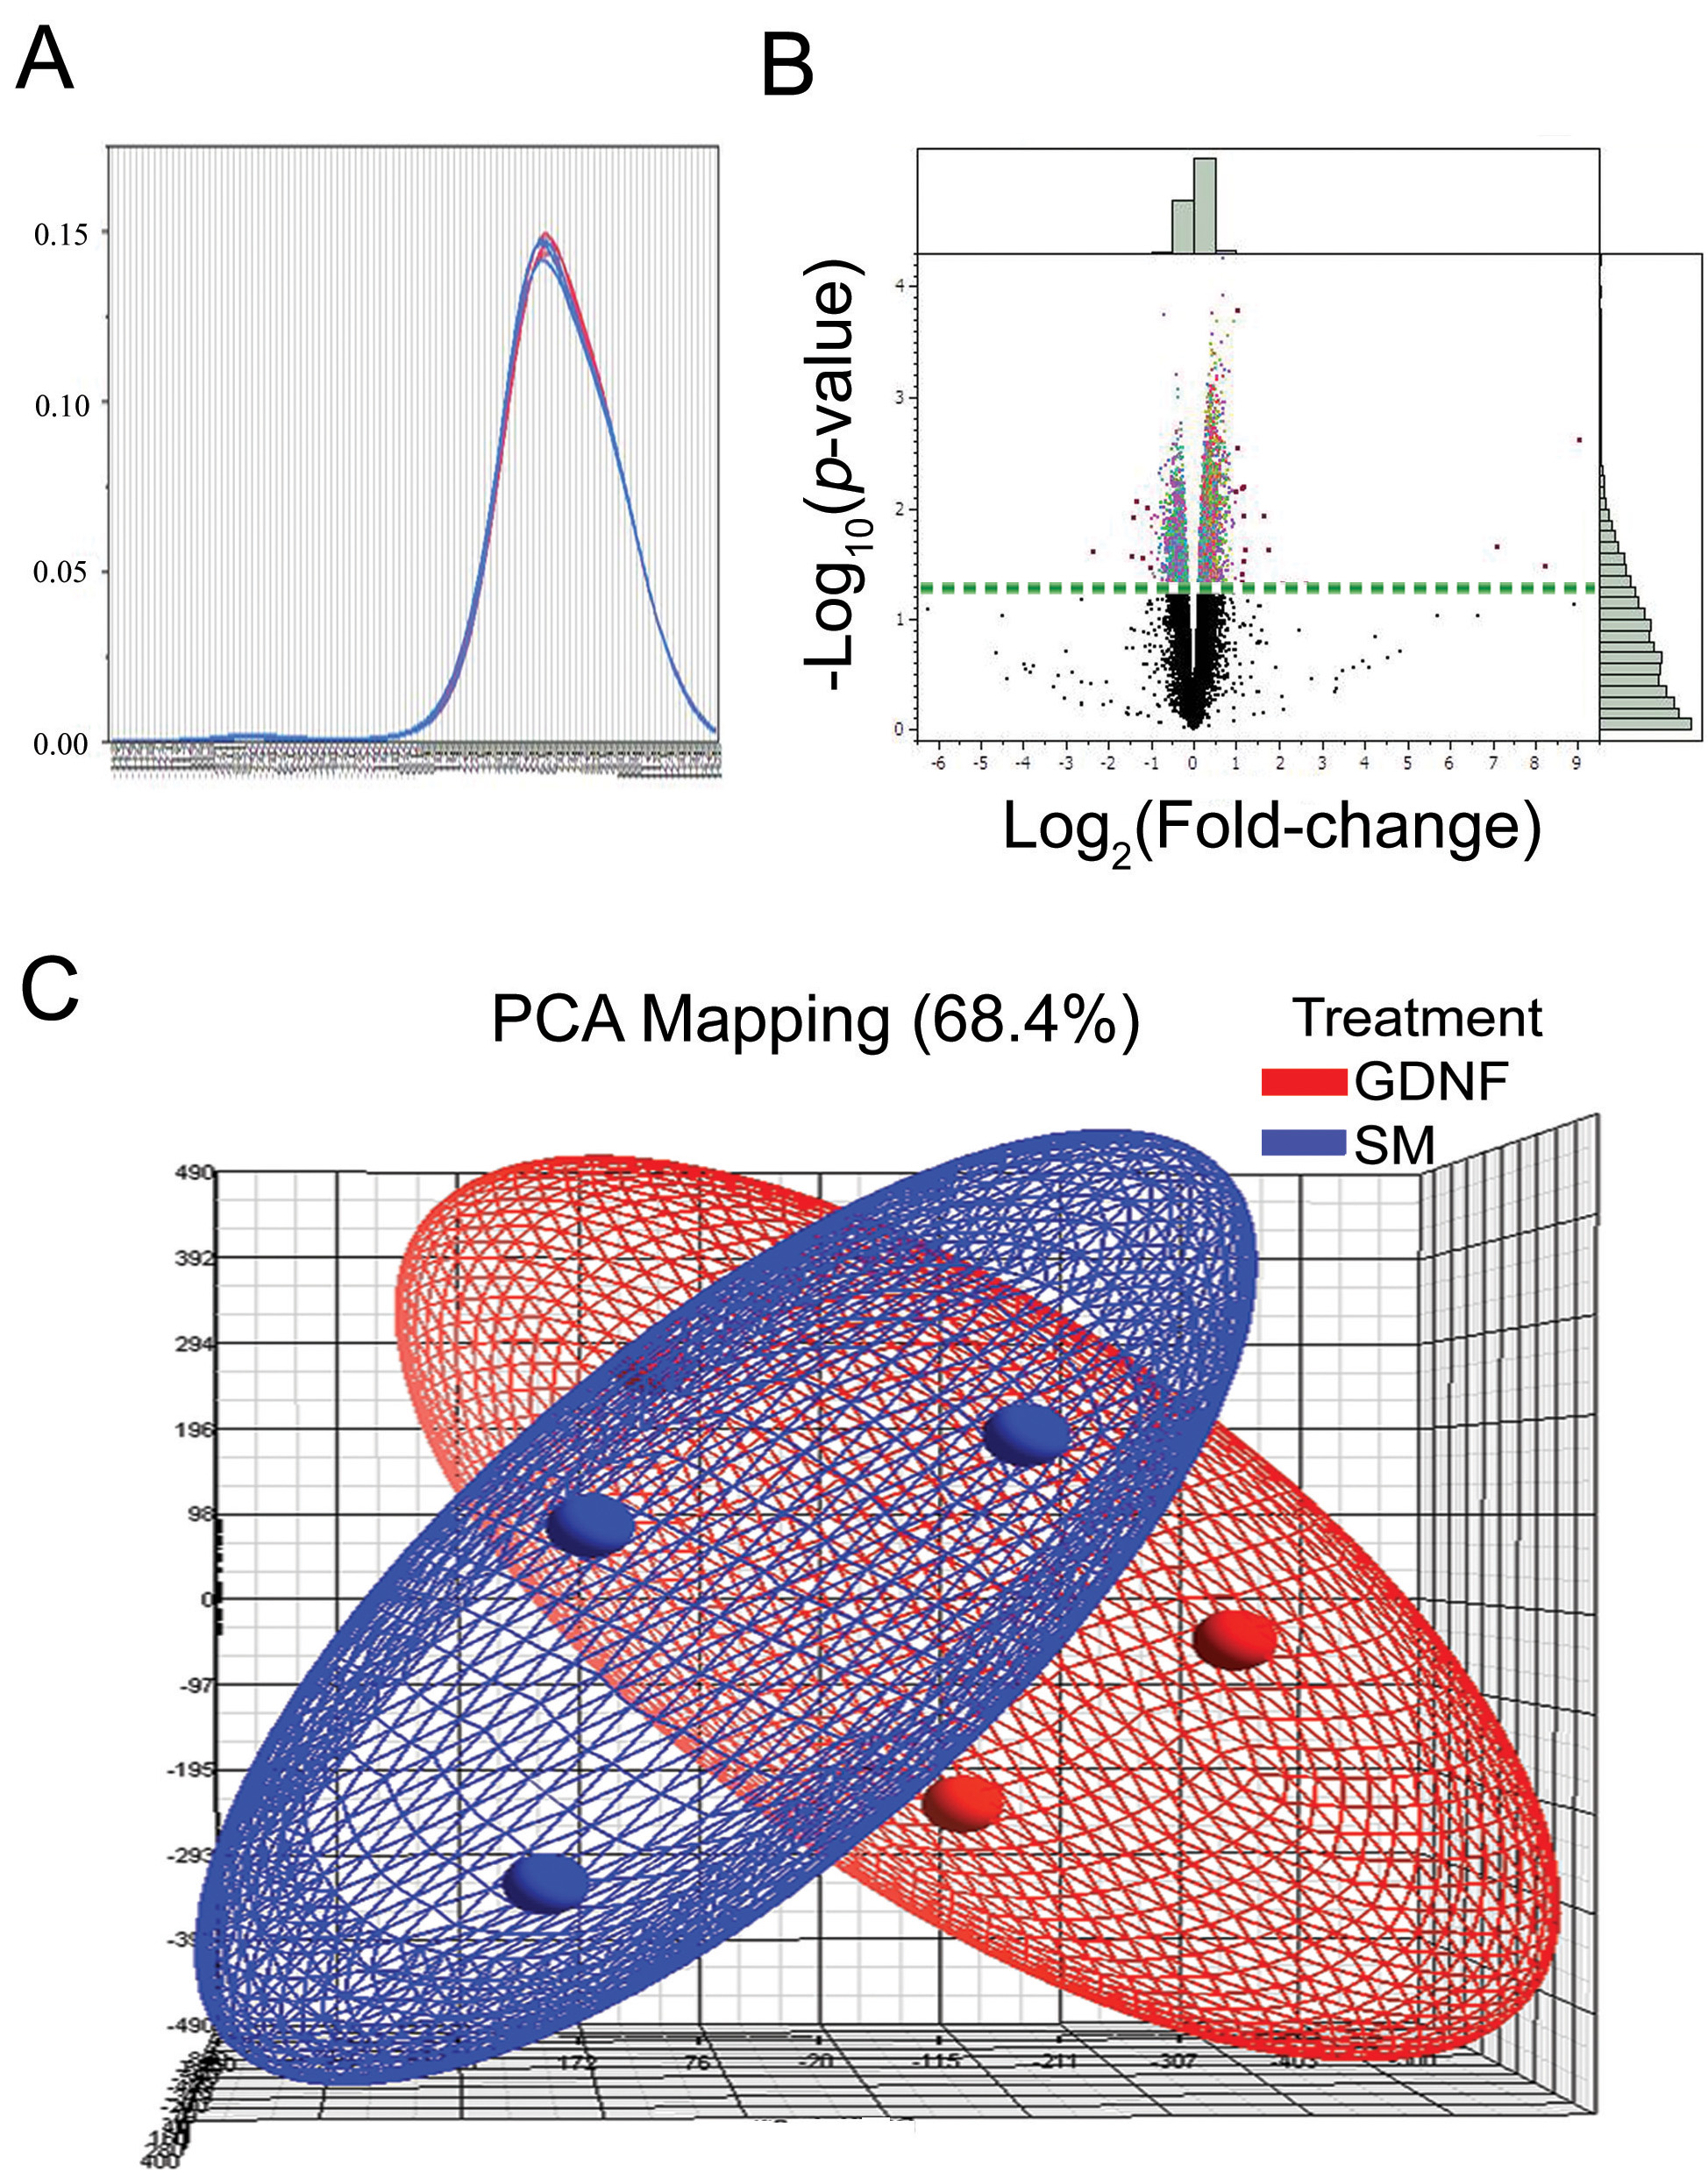
Figure 7. Overlayed kernel density
estimates, principle component analysis, and volcano plot.
A:
Overlayed kernel density estimates show the raw univariate
distributions for all arrays. The distributions for these arrays are
very similar, indicating that this is a high-quality data set that
should require little if any normalization for further analysis.
B:
Volcano
plot from ANOVA analysis of the differential expression under
epidermal growth factor (EGF) and EGF+glial cell line-derived
neurotrophic factor (GDNF) conditions reveals differentially expressed
genes. The fold change values between two conditions (log
10
transformed) were plotted on the x-axis and were compared to the
negative log
10 transformed p values on the y-axis. Genes
with a transformed p value of at least 0.05 and a transformed fold
change of at least two in the upper left and upper right of the volcano
plot are highlighted in red. Among these genes, eight are predicted
genes and the other 16 are listed in
Table 2. Histograms along the
borders were generated via all detected genes. The dotted straight
horizontal line represents the value 1.3 [-log
10 (p
value=0.05)], and the genes above that line are significantly different
in expression level between the two conditions. The pale green bars in
the histograms along the borders show numbers of all genes, and the
dark green bars inside represent genes with a p value of <0.05.
C:
Principle
component analysis (PCA) of gene expression signals reveals a
broad degree of overlap in expression patterns between the two
treatment conditions, with little suggestion of a treatment effect.
Blue indicates data from retinal progenitor cells (RPCs) cultured in
standard, epidermal growth factor-based medium (SM), while red
indicates data from standard medium supplemented with GDNF. Individual
microarrays (3 each condition) are indicated as small orbs and the
general data distribution for each condition as an elliptical field of
the corresponding color.
 Figure 7 of Wang, Mol Vis 2010; 16:2850-2866.