Figure 6. Change in caspase-3 activity. Cells were compared in terms of caspase activity under the same treatment conditions used previously,
i.e., no growth factor, glial cell line-derived neurotrophic factor (GDNF), epidermal growth factor (EGF) and EGF+GDNF for
24 h. Experiments were performed in triplicate. Caspase-3 activity was evaluated spectrophotometrically at 405 nm in whole-cell
lysates and calculated by construction of a para-nitroaniline calibration curve (data not shown). The y-axis represents percentages
of caspase-3 activity related to EGF medium (control; n=10). Data are expressed as the mean±SD (p>0.05 versus EGF; p<0.05
versus EGF; p<0.05 versus no growth factor).
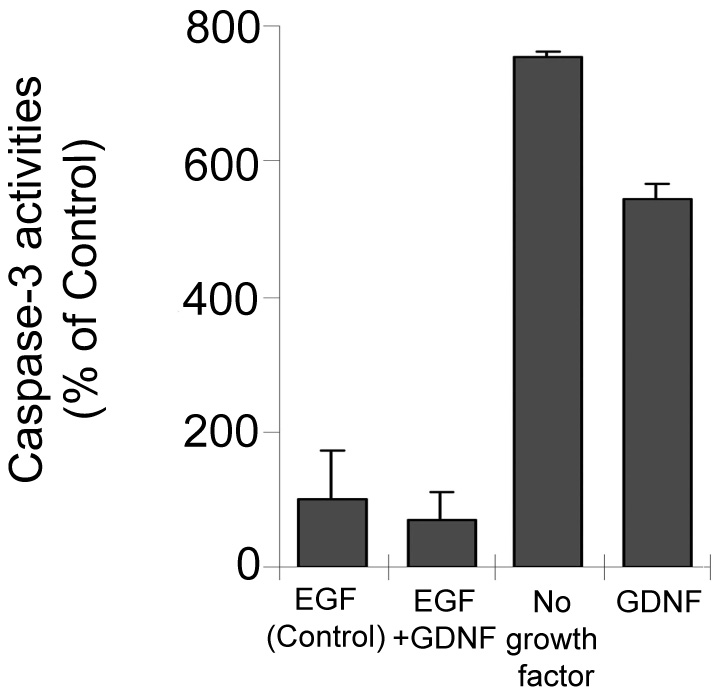
 Figure 6 of
Wang, Mol Vis 2010; 16:2850-2866.
Figure 6 of
Wang, Mol Vis 2010; 16:2850-2866.