Figure 4. Quantitative analysis of sphere
formation under different culture conditions. The left panel shows
phase (A) and fluorescent (B) photomicrographs of murine
retinal progenitor cells (RPCs). Examples of object thresholding and
quantification using image analysis software are shown (C-F),
with
white indicating selected objects and red indicating rejected
objects. Specifically, a given microscopic field is thresholded to
select all spheres (C), small spheres (D), middle-sized
spheres (E), and large spheres (F; none present in this
image). The scale bar is 400 µm. Right panel: RPCs were cultured in
medium containing epidermal growth factor (EGF) or EGF + glial cell
line-derived neurotrophic factor (GDNF) for 5 days. Number and
cross-sectional area of spherical cellular aggregates (spheres) larger
than 870 µm2 are shown for each time point. Spheres meeting
threshold criteria increased in number along the time course in both
conditions. Significantly greater numbers and larger area of the
spheres were found in the EGF+GDNF condition, compared to EGF at day 5,
with the earlier trend seen at day 1 and day 3 not reaching statistical
significance by the criterion used. Data represent the mean of six
samples from same plating (*p<0.05). x-axis shows different medium
conditions at day 1, 3, and 5; y-axis shows the number of spheres.
Different shading within the histogram shows sphere area (µm2).
Black
is for small spheres, light gray for middle-sized, and dark gray
for large. Standard deviation was used to generate the error bars,
which reflect the sphere numbers.
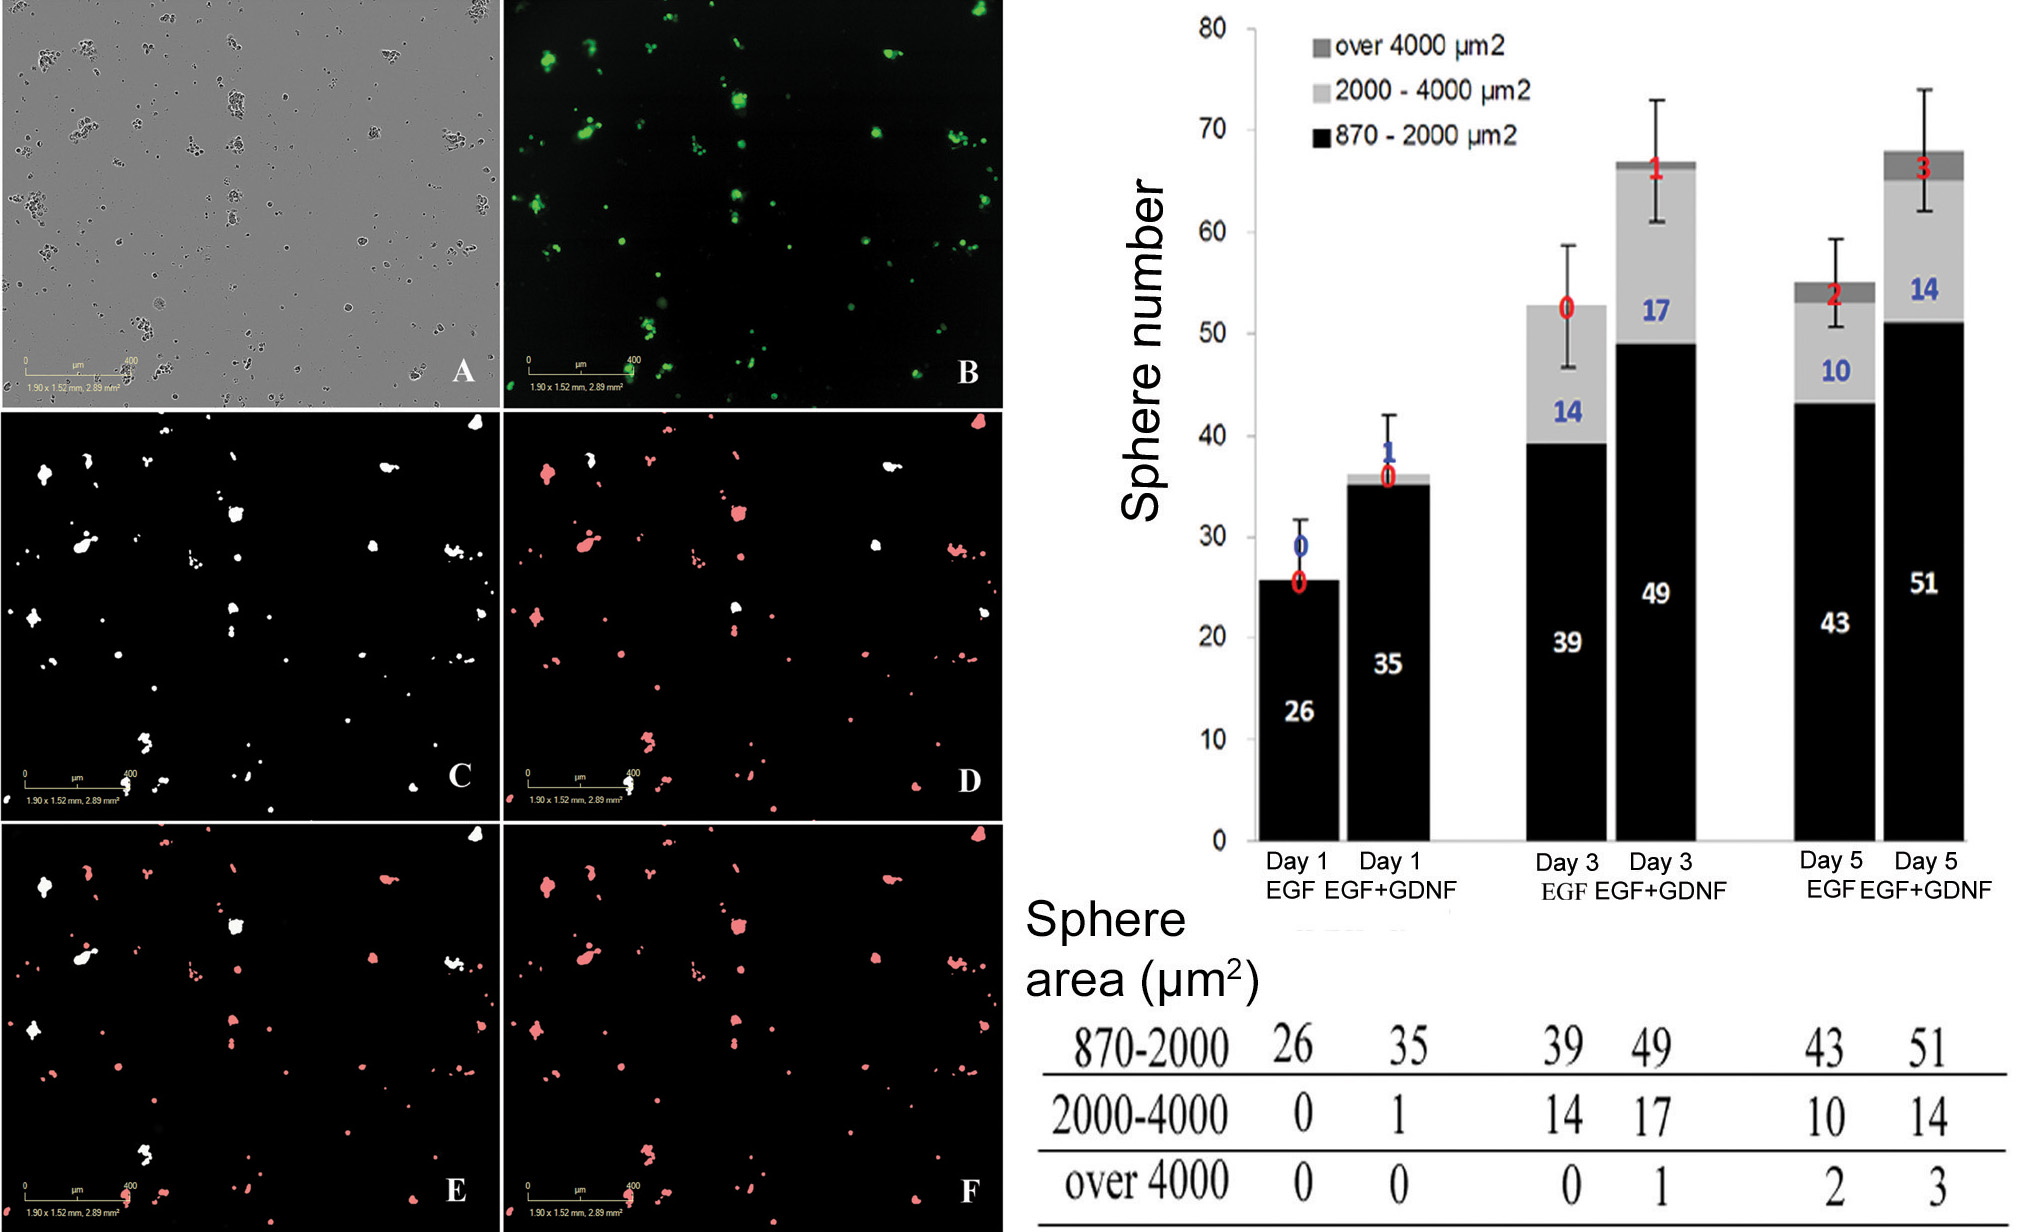
 Figure 4 of Wang, Mol Vis 2010; 16:2850-2866.