Figure 1. Gene expression profile of
retinal progenitor cell progenitor markers under different
concentrations of glial cell line-derived neurotrophic factor
treatment. Cultured genetically modified (GFP+) RPCs were treated with
2.5, 5,
10, and 20 ng/ml of glial cell line-derived neurotrophic factor (GDNF)
for 5 days, then RNA was isolated, and quantitative polymerase chain
reaction (qPCR) assay was performed. The progenitor markers in those
samples remained at similar levels under different concentrations of
GDNF. In each gene column, the five bars from left to right represent
cells in epidermal growth factor (EGF) alone (dark red), in EGF+2.5
ng/ml GDNF (dark green), in EGF+5 ng/ml GDNF (blue), in EGF+10 ng/ml
GDNF (red), and in EGF+20 ng/ml GDNF (green).
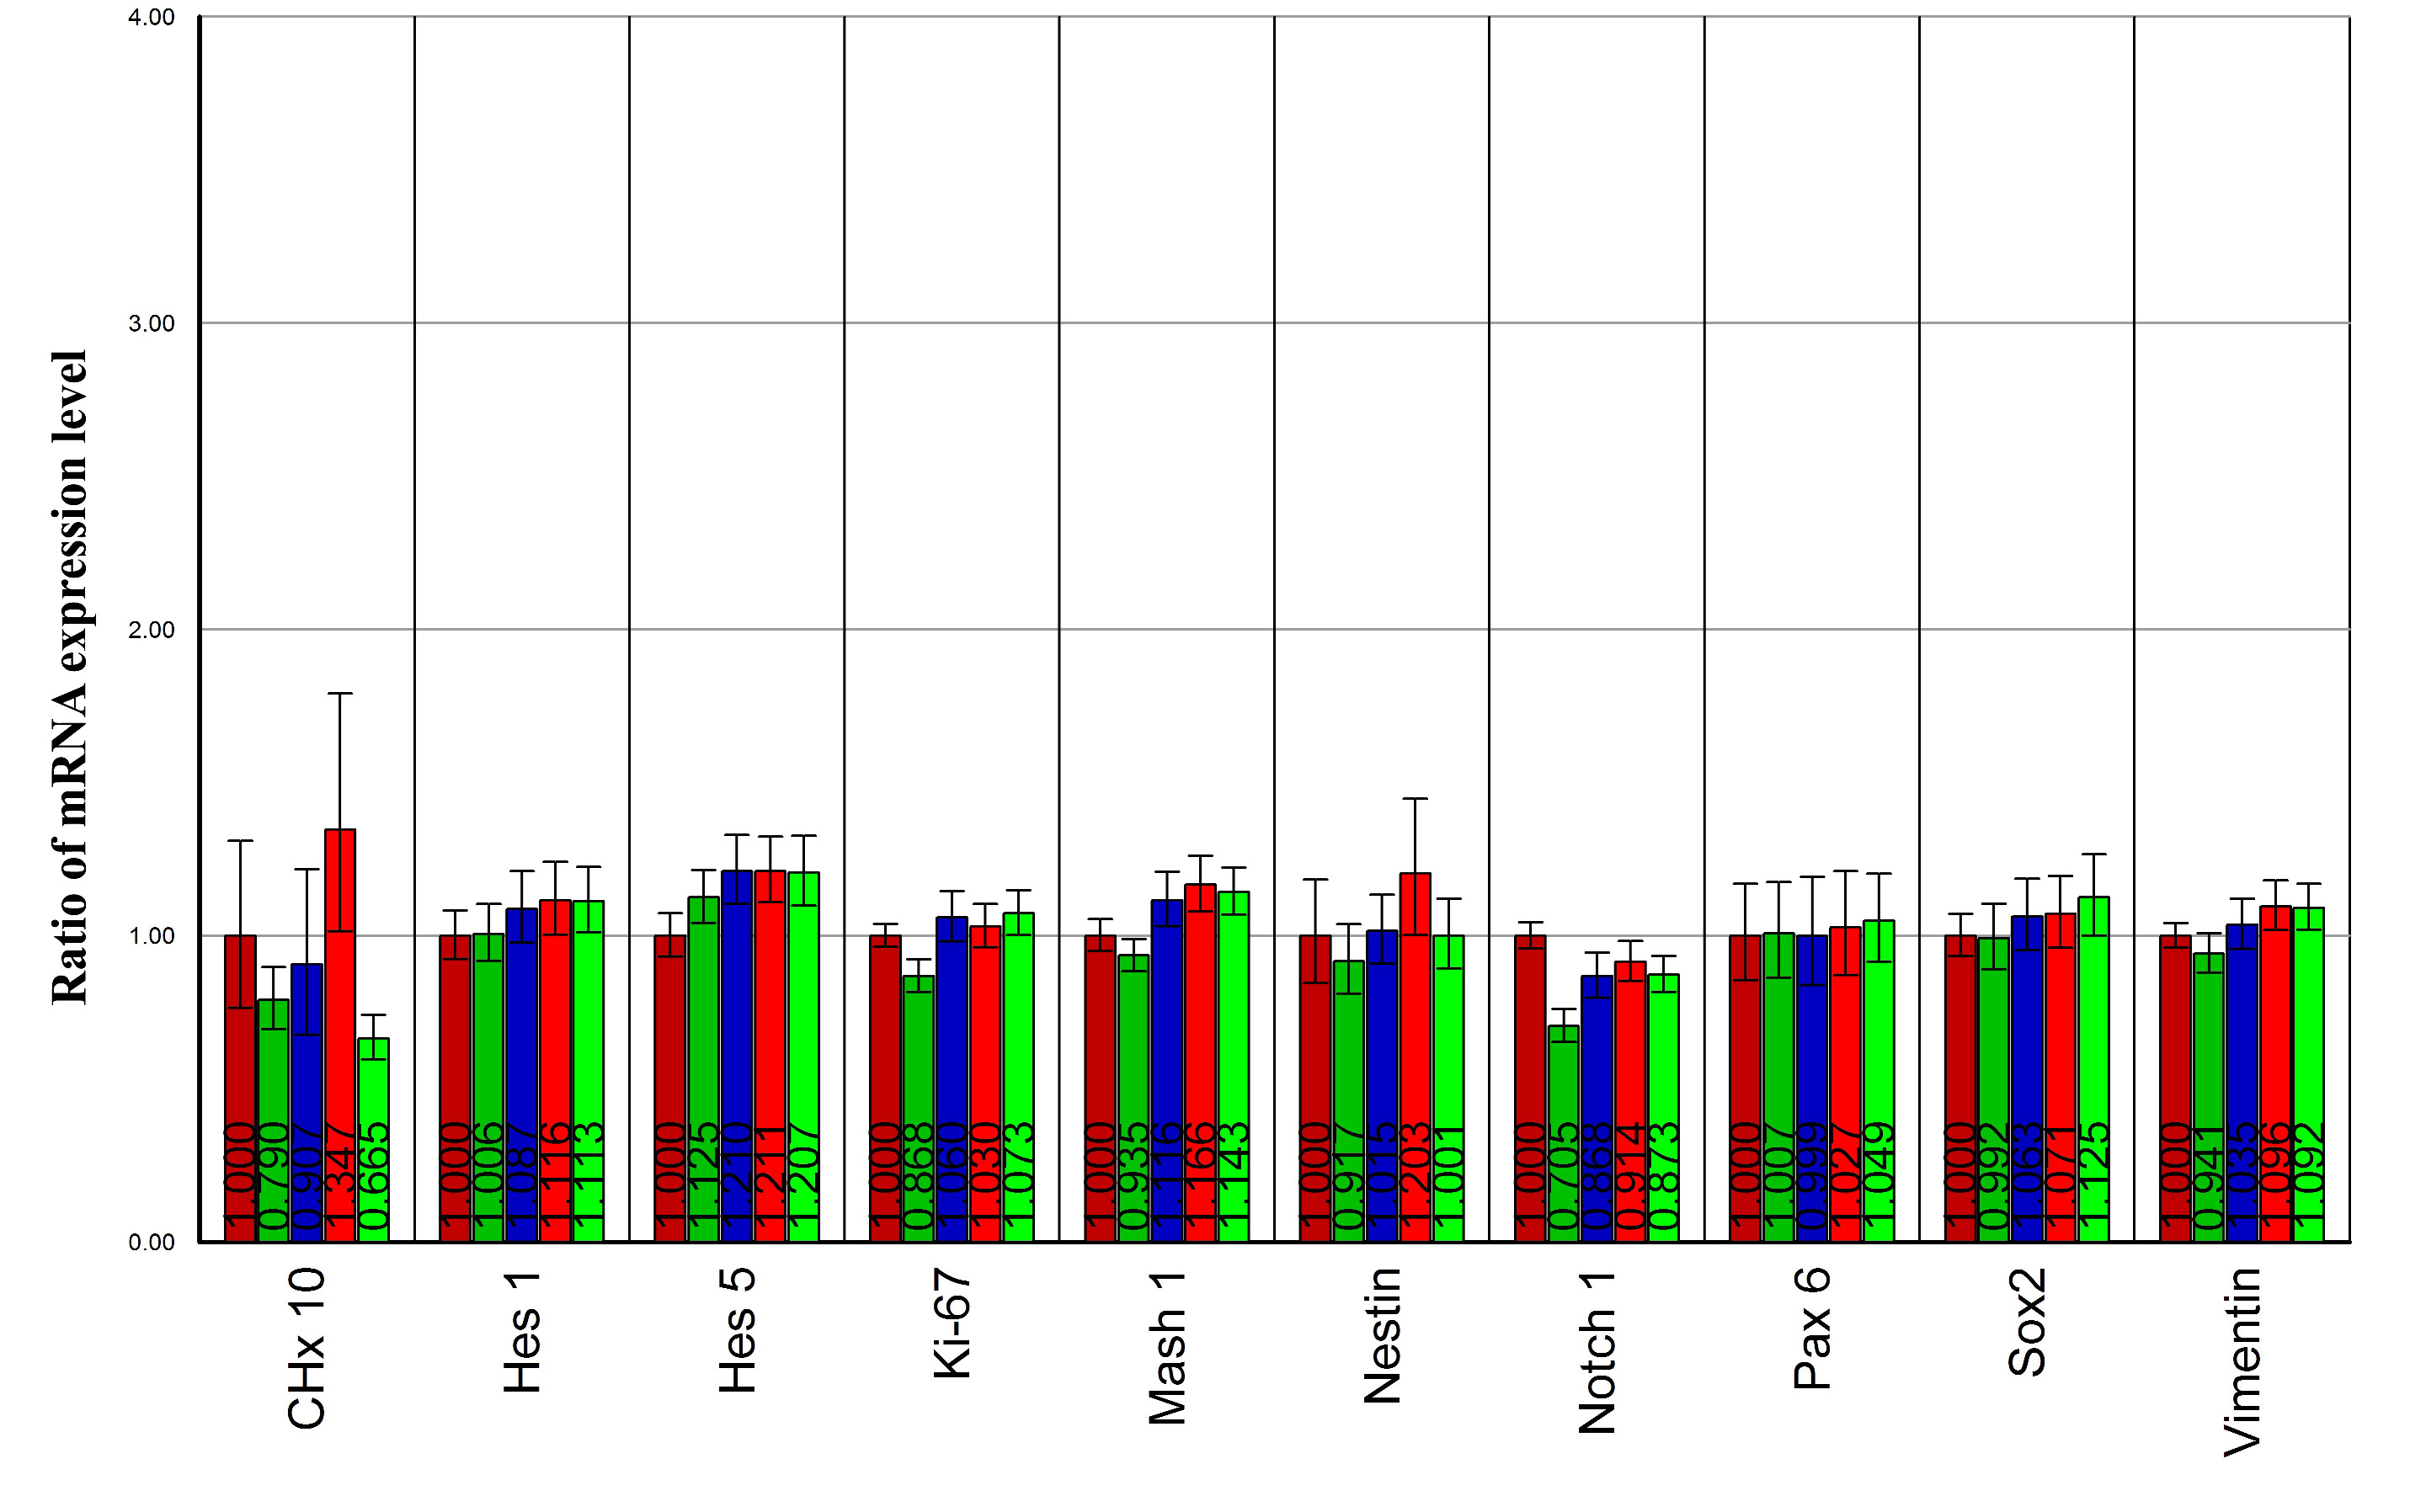
 Figure 1 of Wang, Mol Vis 2010; 16:2850-2866.