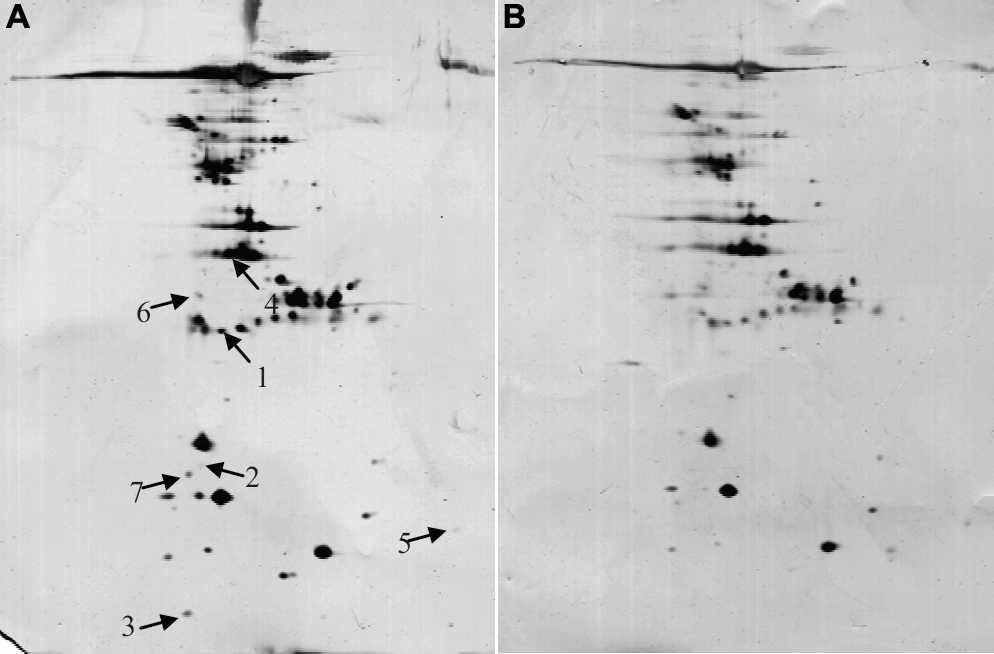
Figure 1. Silver-stained 2D gels of AH.
A and
B show representative gels from a patient (
A: patient number 1 in
Table1) and a gel from a control subject (
B: control number 1 in
Table1). Total protein concentration in AH was 0.3217 mg/ml from the patient and 0.2924 mg/ml from the control. Arrows and numbers
show 8 spots in the patient sample with volumes significantly increased by values greater than 2 fold in the patients. The
identities of the spots were derived from prostaglandin H2 D-isomerase (PGDS; spot 1), caspase 14 precursor (spot 2 and4),
transthyretin (spot 3 and 5), cystain C (spot 6), albumin precursor (spot 7), and tranferrin (spot 8).
 Figure 1 of
Duan, Mol Vis 2010; 16:2839-2846.
Figure 1 of
Duan, Mol Vis 2010; 16:2839-2846.