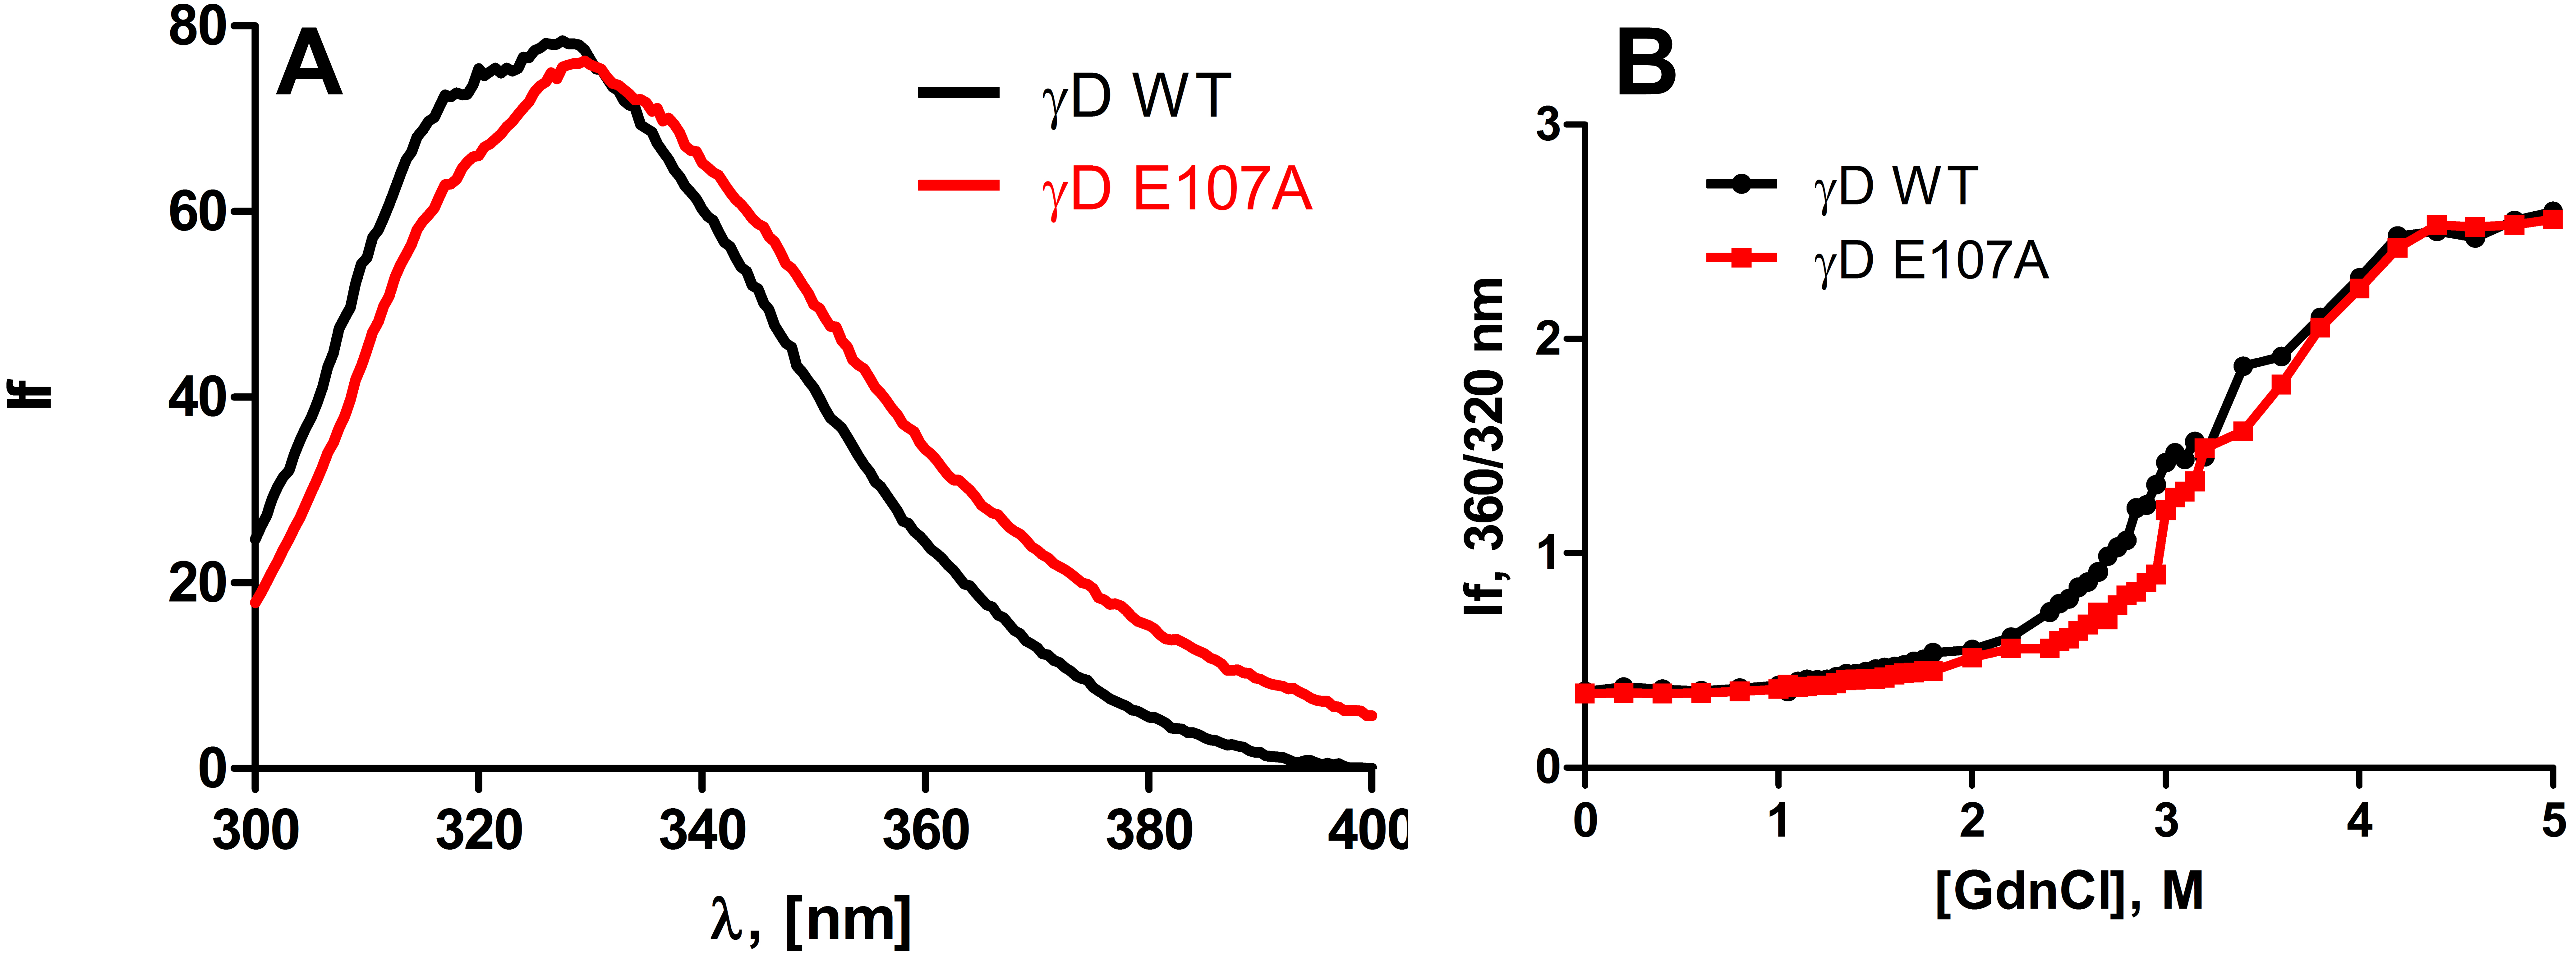
Figure 2. Wild type and E107A mutant
differ very little in their surface exposure of apolar residues and in
their structural stability. A: Intrinsic fluorescence of
wild-type and E107A mutant HGDC. The protein concentrations used were
10 μM (0.2 mg/ml) in MOPS buffer, pH 7.3, cell path length 2 mm, and
spectra were recorded at room temperature, using an excitation
wavelength of 295 nm, with 2.5 nm slits. B: Guanidinium
chloride–induced denaturation of wild-type and E107A HGDC. The relative
emission intensity of the 360 nm band (of the denatured form) was
compared to that of the 320 nm band (of the native protein) and
monitored as a function of denaturant concentration.

 Figure 2 of Vendra, Mol Vis 2010; 16:2822-2828.
  Figure 2 of Vendra, Mol Vis 2010; 16:2822-2828.