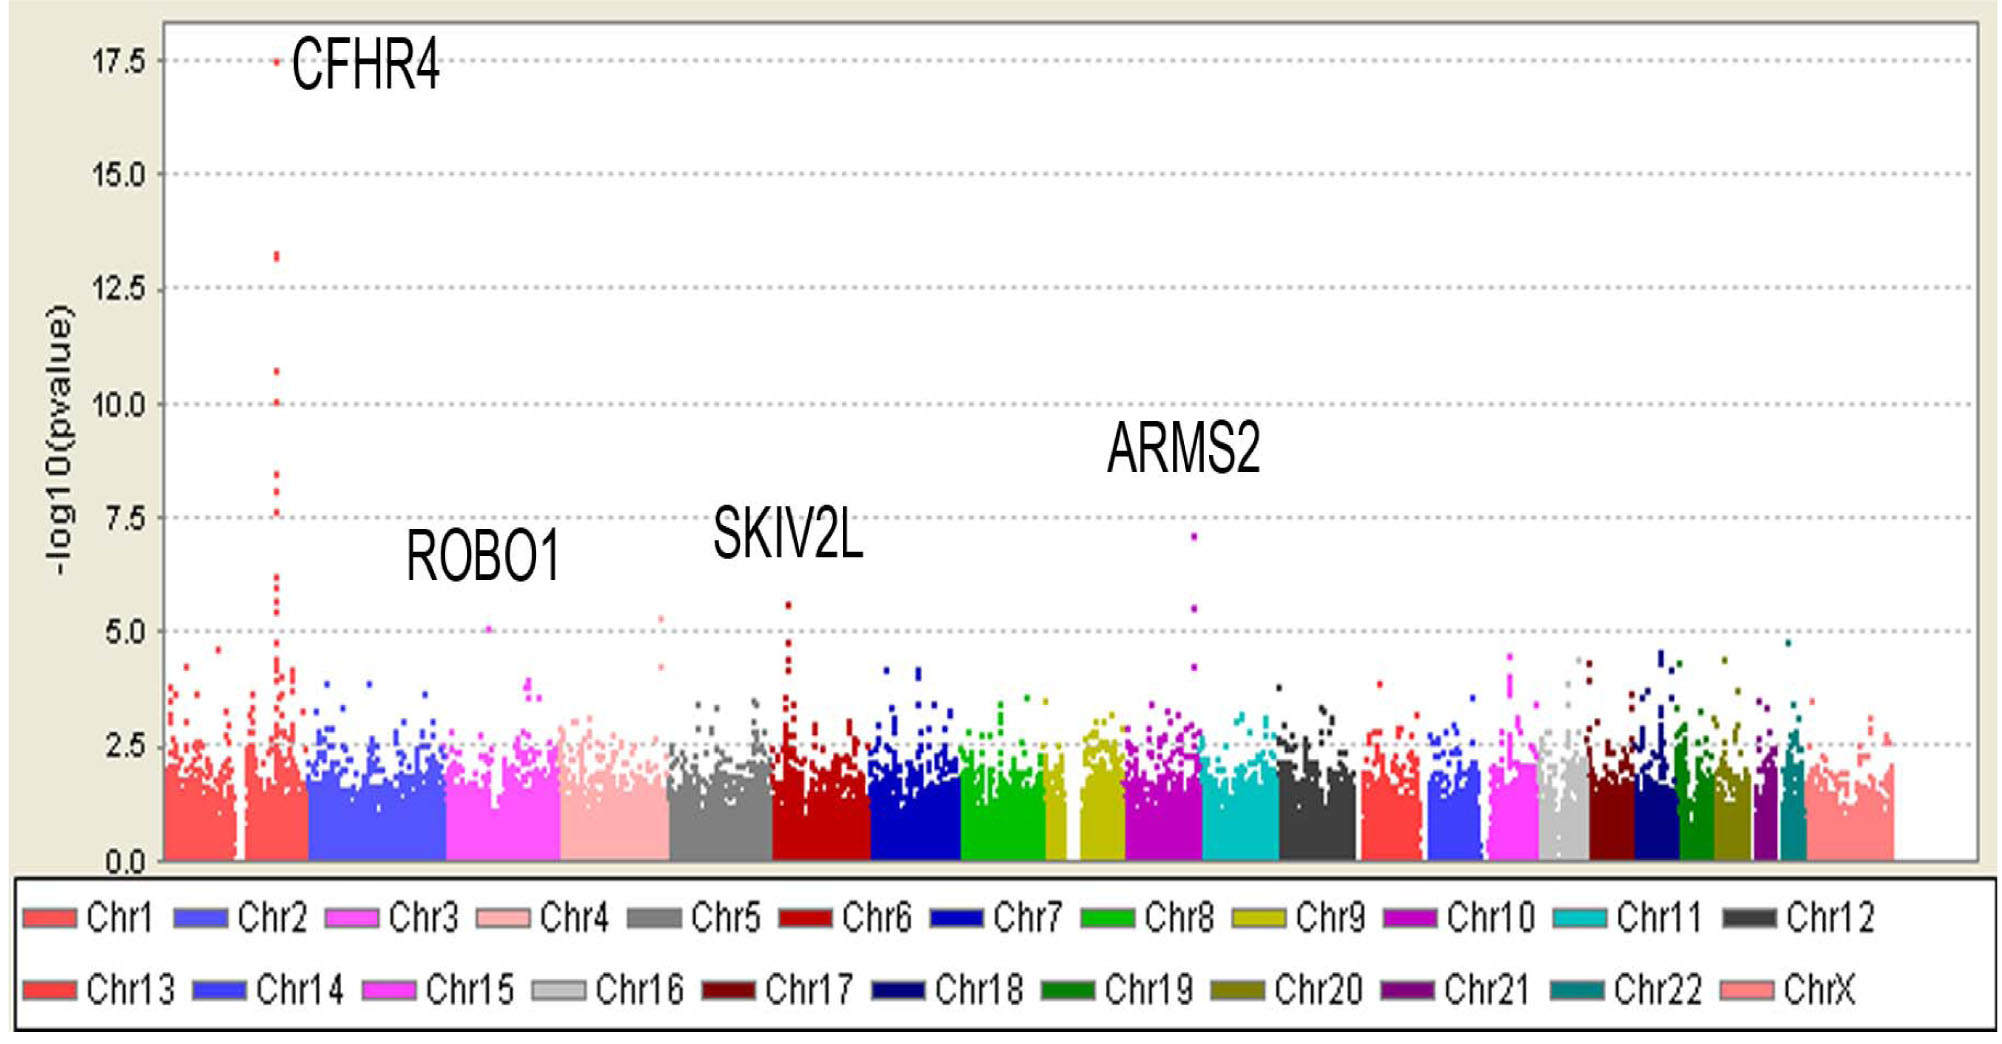
Figure 4. The association of single single
nucleotide polymorphisms (SNPs) with age-related macular degeneration
(AMD) across the genome. Significance across the genome is illustrated
by plotting −log 10 (p values) from the log-additive genetic model
corrected for population stratification. The loci with p values less
than 0.00001 are labeled and the SNPs are provided in
Table 2.
 Figure 4 of Ryu, Mol Vis 2010; 16:2811-2821.