Figure 3. Quantile-quantile plots of the
age-related eye disease study (AREDS) genome-wide association study
(GWAS). A: Scatter plot of the −log10 (p values) expected under
the null hypothesis of no genetic association versus the observed
−log10 (p values) are shown for all subjects. B: This is a
scatter plot as in A, but for white subjects only. C:
This is a scatter plot of white subjects corrected for population
stratification using principal components methods without exclusion of
known loci. D: This is a scatter plot of white subjects
corrected for population stratification using principal components
methods with exclusion of known loci. A–C: These plots
show that correction for population stratification reduced the genomic
inflation factor from 1.23 to 1.01. D: This plot suggests that
there is evidence for additional single nucleotide polymorphisms (SNPs)
contributing to age-related macular degeneration (AMD) after
statistically accounting for known loci.
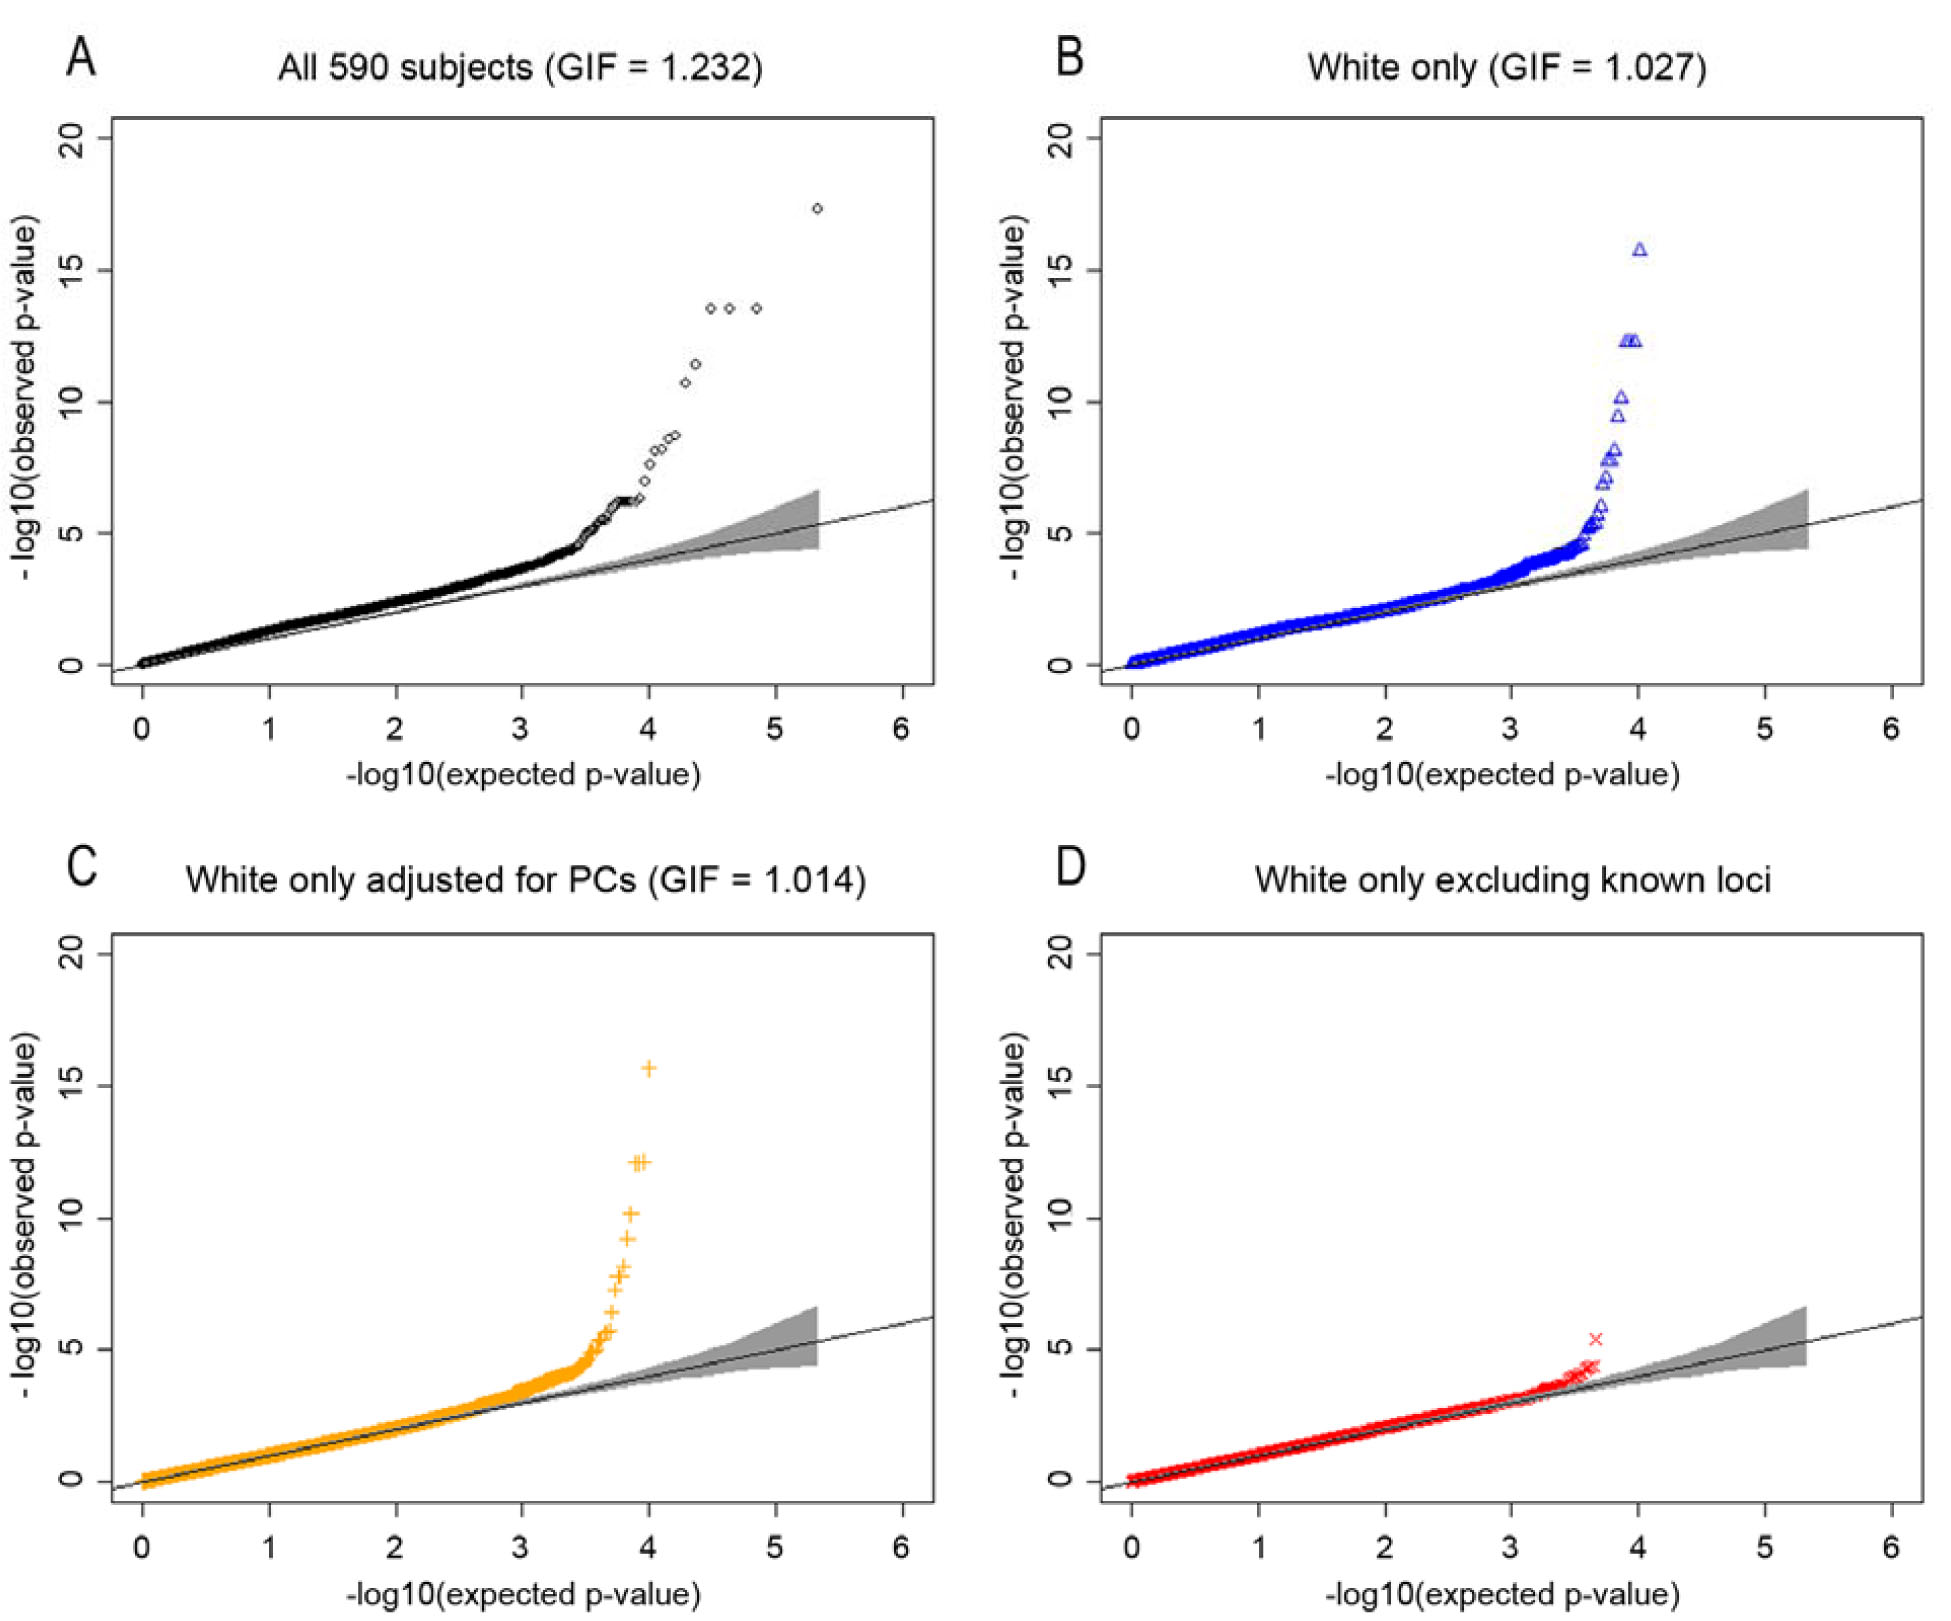
 Figure 3 of Ryu, Mol Vis 2010; 16:2811-2821.