Figure 2. Population stratification in the
age-related eye disease study (AREDS) subjects. Three race categories
are presented in pink circle for white, non-Hispanics (White), in black
triangle for blacks (Black), and in green cross for subjects who are
neither white, non-Hispanics nor blacks. A plot of the first two
principal components using 103,895 single nucleotide polymorphisms
(SNPs) passing quality-control filters. Of the total 590 subjects, the
self-reported race was white, non-Hispanic for 576, black for 12, and
“other” for 2. The figure shows that one black subject and two other
subjects were similar to the white subjects. There was also
stratification among the white subjects, for which we corrected in
subsequent analyses. The x-axis shows the first principal component
axis (PC1), while the y-axis shows the second component (PC2).
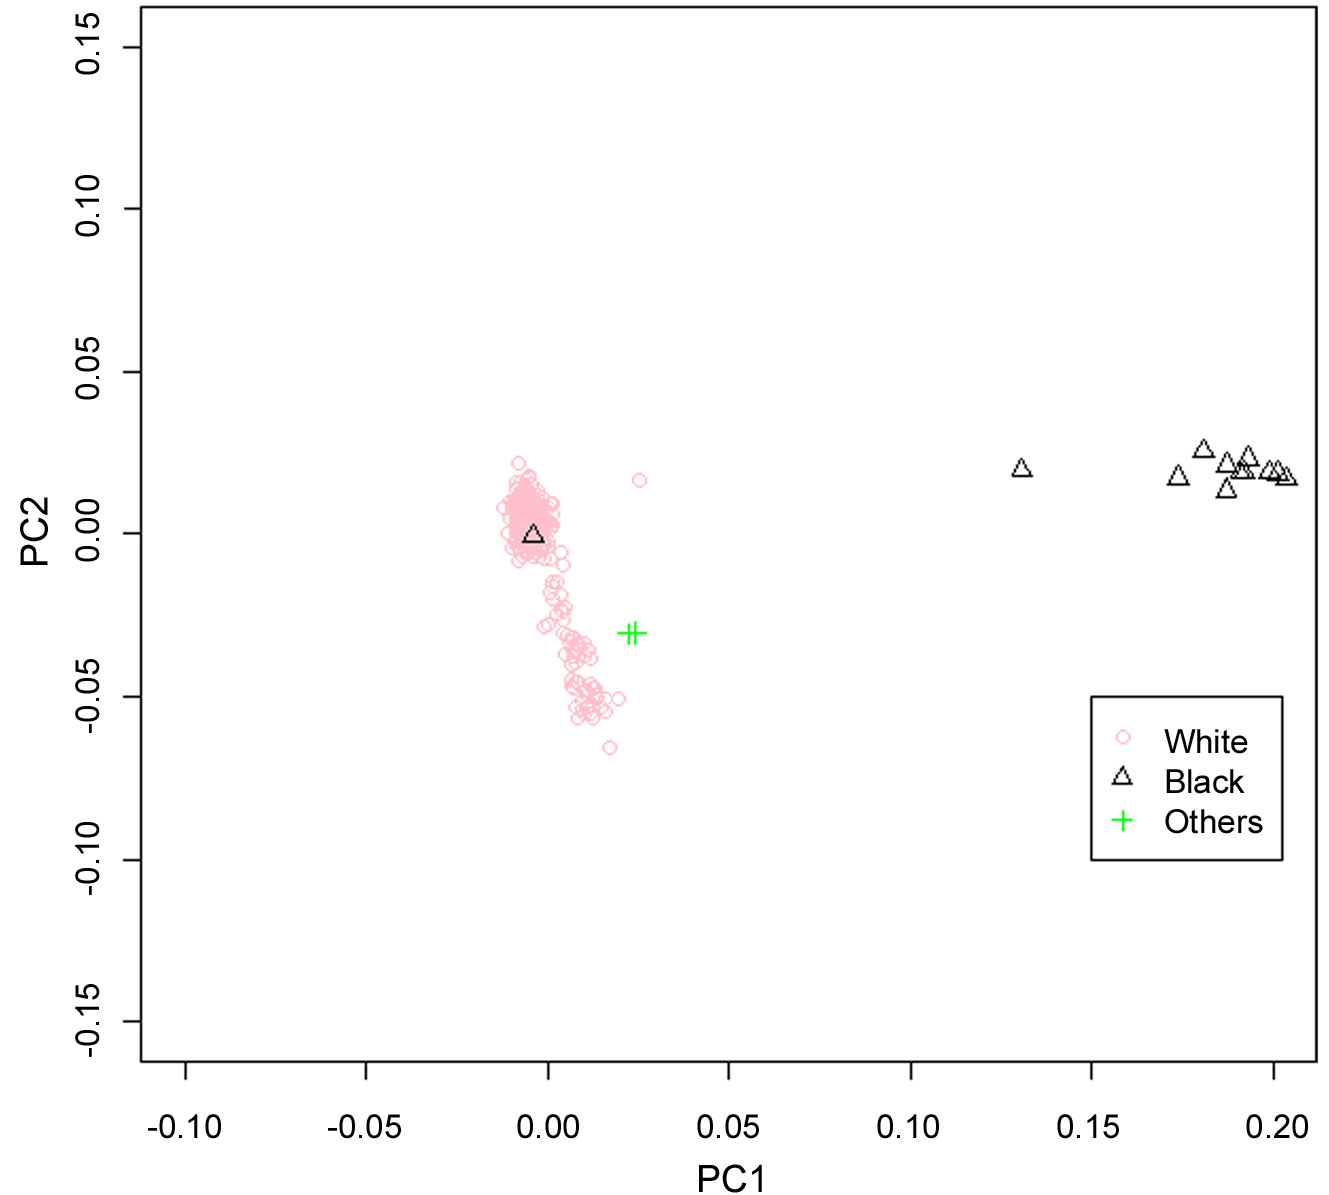
 Figure 2 of Ryu, Mol Vis 2010; 16:2811-2821.