Figure 5. Representative tryptophan
fluorescence spectra of HGDC samples with various concentrations of
GdnHCl. A: Non-irradiated HGDC and supernatant fraction of UV-C
irradiated HGDC (S). B: Non-irradiated HGDC and re-dissolved
precipitated fraction of UV-C irradiated HGDC (R).
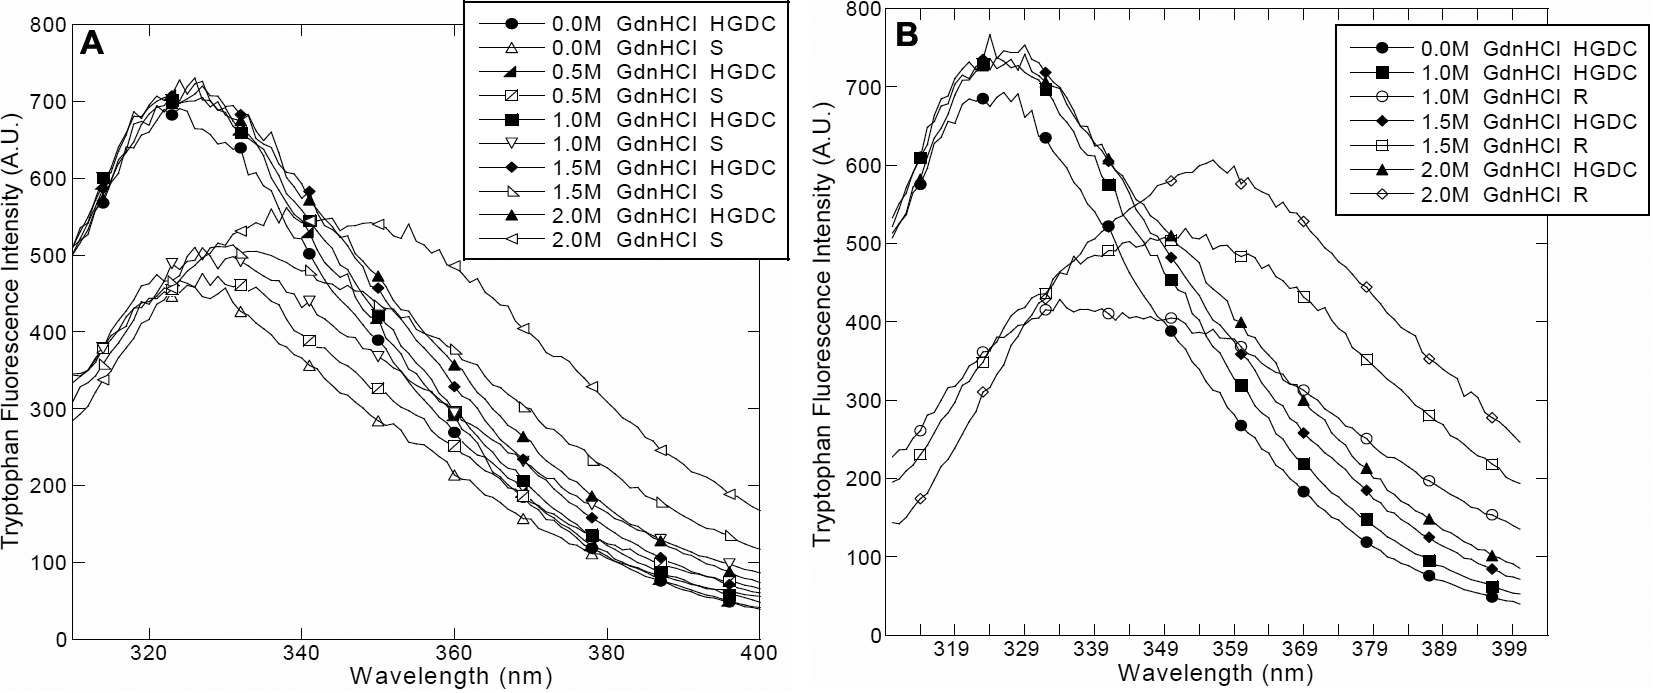
 Figure 5 of Wang, Mol Vis 2010; 16:2777-2790.